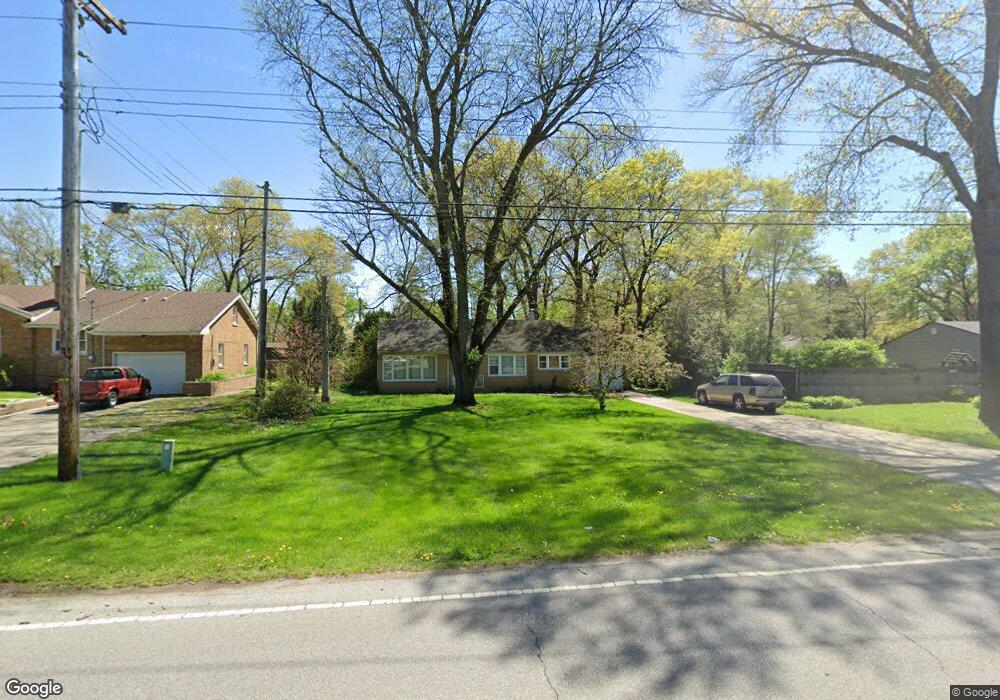
2211 W 41st Ave Gary, IN 46408
Ross NeighborhoodEstimated Value: $146,000 - $215,000
3
Beds
2
Baths
1,351
Sq Ft
$135/Sq Ft
Est. Value
About This Home
This home is located at 2211 W 41st Ave, Gary, IN 46408 and is currently estimated at $182,899, approximately $135 per square foot. 2211 W 41st Ave is a home located in Lake County with nearby schools including Calumet High School, Steel City Academy, and Ambassador Academy.
Ownership History
Date
Name
Owned For
Owner Type
Purchase Details
Closed on
Dec 9, 2022
Sold by
Jorgensen Max
Bought by
Moses Springs Llc Series 17
Current Estimated Value
Purchase Details
Closed on
Dec 5, 2022
Sold by
Jorgensen Max
Bought by
Moses Springs Llc Series 17
Purchase Details
Closed on
Jul 18, 2018
Sold by
Capital Group Llc
Bought by
Jorgensen Max
Home Financials for this Owner
Home Financials are based on the most recent Mortgage that was taken out on this home.
Original Mortgage
$79,920
Interest Rate
4.5%
Mortgage Type
New Conventional
Purchase Details
Closed on
Feb 16, 2018
Sold by
Housemart Inc
Bought by
2211 W 41St Avenue Land Trust
Purchase Details
Closed on
Nov 3, 2017
Sold by
Hollerman Julia Ann and Hollerman Kenneth
Bought by
Federal National Mortgage Association
Create a Home Valuation Report for This Property
The Home Valuation Report is an in-depth analysis detailing your home's value as well as a comparison with similar homes in the area
Home Values in the Area
Average Home Value in this Area
Purchase History
| Date | Buyer | Sale Price | Title Company |
|---|---|---|---|
| Moses Springs Llc Series 17 | -- | None Listed On Document | |
| Moses Springs Llc Series 17 | -- | -- | |
| Jorgensen Max | -- | None Available | |
| 2211 W 41St Avenue Land Trust | -- | Indiana Title Network Co | |
| Federal National Mortgage Association | $42,601 | None Available |
Source: Public Records
Mortgage History
| Date | Status | Borrower | Loan Amount |
|---|---|---|---|
| Previous Owner | Jorgensen Max | $79,920 |
Source: Public Records
Tax History Compared to Growth
Tax History
| Year | Tax Paid | Tax Assessment Tax Assessment Total Assessment is a certain percentage of the fair market value that is determined by local assessors to be the total taxable value of land and additions on the property. | Land | Improvement |
|---|---|---|---|---|
| 2024 | $4,307 | $105,300 | $23,600 | $81,700 |
| 2023 | $1,930 | $101,100 | $23,600 | $77,500 |
| 2022 | $1,930 | $96,500 | $23,500 | $73,000 |
| 2021 | $1,812 | $90,600 | $23,500 | $67,100 |
| 2020 | $1,838 | $91,900 | $23,500 | $68,400 |
| 2019 | $1,801 | $85,800 | $22,100 | $63,700 |
| 2018 | $2,591 | $87,700 | $22,600 | $65,100 |
| 2017 | $579 | $88,600 | $22,600 | $66,000 |
| 2016 | $770 | $98,200 | $22,600 | $75,600 |
| 2014 | $647 | $99,400 | $23,300 | $76,100 |
| 2013 | $557 | $96,900 | $23,300 | $73,600 |
Source: Public Records
Map
Nearby Homes
- 4300 Roosevelt Place
- 4056 Cleveland St
- 2345 Ranburn Dr
- 2100 Crest Rd
- 3725 Cleveland St
- 3847 Taft St
- 4401 W Taft St
- 4381 Richard Gordon Hatcher Blvd
- 3816 Lincoln St
- 3701 Grant St
- 4034 Fillmore St
- 3044 W Ridge Rd Unit Rear
- 4115 Fillmore St
- 4673 Arthur St
- 4645 Hayes St
- 4017 Polk St
- 1226 W 45th Ave Unit 34
- 1977 W 47th Ave
- 3654 Buchanan St
- 3642 Buchanan St
- 2145 W 41st Ave
- 2221 W 41st Ave
- 4121 Oak Ln
- 4140 Roosevelt Ct
- 2131 W 41st Ave
- 4141 Roosevelt Ct
- 4403 Roosevelt Place
- 4127 Oak Ln
- 2121 W 41st Ave
- 4148 Roosevelt Ct
- 2120 W 41st Ave
- 4171 Roosevelt Ct
- 2200 W 41st Ave
- 2150 W 41st Ave
- 4112 Oak Ln
- 2216 W 41st Ave
- 2043 W 41st Ave
- 2118 W 41st Ave
- 2245 W 41st Ave
- 2132 Oak Ln