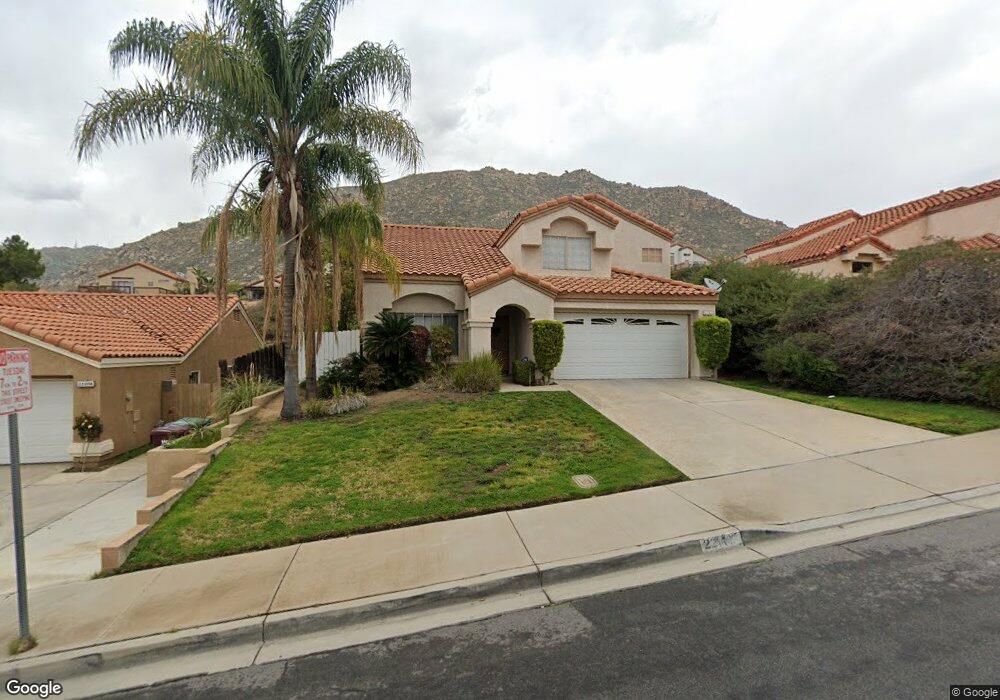
22110 Spring Crest Rd Moreno Valley, CA 92557
North Moreno Valley NeighborhoodEstimated Value: $562,949 - $615,000
4
Beds
3
Baths
1,737
Sq Ft
$339/Sq Ft
Est. Value
About This Home
This home is located at 22110 Spring Crest Rd, Moreno Valley, CA 92557 and is currently estimated at $587,987, approximately $338 per square foot. 22110 Spring Crest Rd is a home located in Riverside County with nearby schools including Box Springs Elementary School, Vista Heights Middle School, and Canyon Springs High School.
Ownership History
Date
Name
Owned For
Owner Type
Purchase Details
Closed on
Feb 3, 1997
Sold by
Federal National Mortgage Association
Bought by
Turner Gayle Dorothy
Current Estimated Value
Home Financials for this Owner
Home Financials are based on the most recent Mortgage that was taken out on this home.
Original Mortgage
$109,567
Outstanding Balance
$12,768
Interest Rate
7.9%
Mortgage Type
FHA
Estimated Equity
$575,219
Purchase Details
Closed on
Aug 1, 1996
Sold by
Loya Steven M and Loya Jayne A
Bought by
Federal National Mortgage Association
Purchase Details
Closed on
Jun 22, 1995
Sold by
Loy Steven M and Loya Jayne A
Bought by
Bogdis Michelle Denise
Home Financials for this Owner
Home Financials are based on the most recent Mortgage that was taken out on this home.
Original Mortgage
$130,500
Interest Rate
7.88%
Mortgage Type
Seller Take Back
Create a Home Valuation Report for This Property
The Home Valuation Report is an in-depth analysis detailing your home's value as well as a comparison with similar homes in the area
Home Values in the Area
Average Home Value in this Area
Purchase History
| Date | Buyer | Sale Price | Title Company |
|---|---|---|---|
| Turner Gayle Dorothy | $110,000 | First American Title Ins Co | |
| Federal National Mortgage Association | $102,000 | Continental Lawyers Title Co | |
| Bogdis Michelle Denise | $2,318 | Fidelity National Title Ins |
Source: Public Records
Mortgage History
| Date | Status | Borrower | Loan Amount |
|---|---|---|---|
| Open | Turner Gayle Dorothy | $109,567 | |
| Previous Owner | Bogdis Michelle Denise | $130,500 |
Source: Public Records
Tax History Compared to Growth
Tax History
| Year | Tax Paid | Tax Assessment Tax Assessment Total Assessment is a certain percentage of the fair market value that is determined by local assessors to be the total taxable value of land and additions on the property. | Land | Improvement |
|---|---|---|---|---|
| 2025 | $2,178 | $179,119 | $40,699 | $138,420 |
| 2023 | $2,178 | $172,165 | $39,119 | $133,046 |
| 2022 | $2,100 | $168,790 | $38,352 | $130,438 |
| 2021 | $2,055 | $165,481 | $37,600 | $127,881 |
| 2020 | $2,029 | $163,785 | $37,215 | $126,570 |
| 2019 | $1,997 | $160,575 | $36,486 | $124,089 |
| 2018 | $1,921 | $157,427 | $35,771 | $121,656 |
| 2017 | $1,908 | $154,341 | $35,070 | $119,271 |
| 2016 | $1,889 | $151,316 | $34,383 | $116,933 |
| 2015 | $1,864 | $149,045 | $33,867 | $115,178 |
| 2014 | $1,745 | $146,127 | $33,204 | $112,923 |
Source: Public Records
Map
Nearby Homes
- 22086 Naples Dr
- 21768 Winding Rd
- 21645 Alcorn Dr
- 21695 Del Amo St
- 21665 Box Springs Rd
- 12313 Timlico Ct
- 21479 Douglasis Ct
- 22656 Ashford Cir
- 21480 Marston Ct
- 21484 Dickinson Rd
- 22862 Scotia Ln
- 11735 Country Flower Ln
- 21329 Tennyson Rd
- 21221 Shakespeare Ct
- 11425 Tiffany Ln
- 21320 Box Springs Rd
- 22600 Echo Lake Rd
- 0 Pigeon Pass Rd
- 21250 Tennyson Rd
- 11455 Pigeon Pass Rd
- 22122 Spring Crest Rd
- 22086 Spring Crest Rd
- 22134 Spring Crest Rd
- 22109 Spring Crest Rd
- 22097 Spring Crest Rd
- 22121 Spring Crest Rd
- 22085 Spring Crest Rd
- 22074 Spring Crest Rd
- 22133 Spring Crest Rd
- 22111 Naples Dr
- 22099 Naples Dr
- 22123 Naples Dr
- 22073 Spring Crest Rd
- 22087 Naples Dr
- 22062 Spring Crest Rd
- 22135 Naples Dr
- 11925 Athens Dr
- 22096 Monico Dr
- 22061 Spring Crest Rd
- 22116 Monico Dr