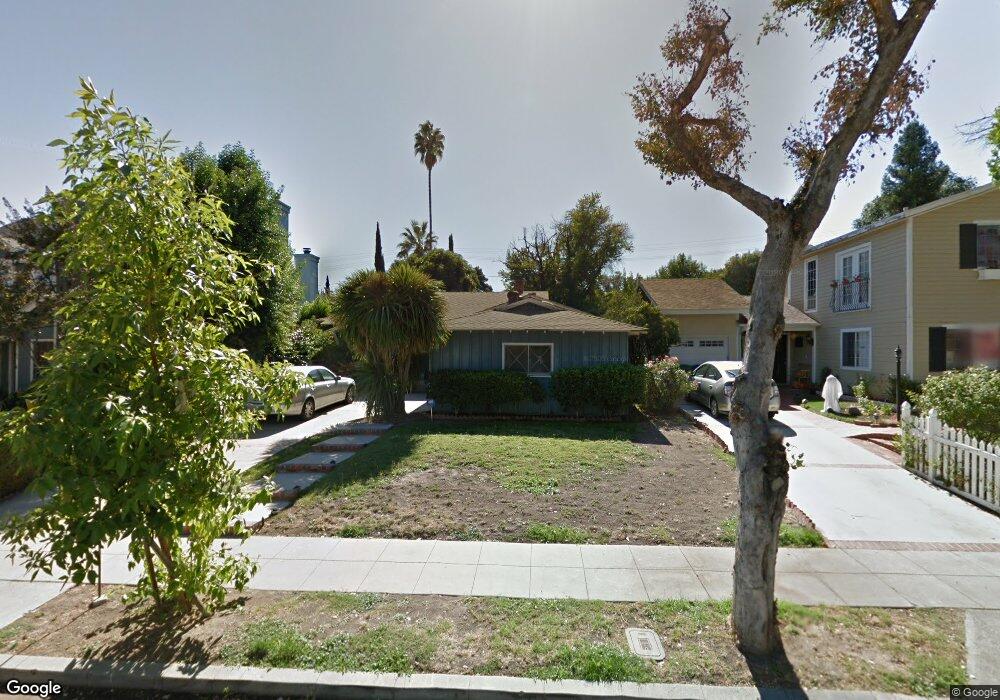
22110 Viscanio Rd Woodland Hills, CA 91364
Estimated Value: $961,000 - $1,346,000
3
Beds
2
Baths
1,631
Sq Ft
$710/Sq Ft
Est. Value
About This Home
This home is located at 22110 Viscanio Rd, Woodland Hills, CA 91364 and is currently estimated at $1,158,313, approximately $710 per square foot. 22110 Viscanio Rd is a home located in Los Angeles County with nearby schools including Woodland Hills Academy, Woodland Hills Elementary Charter For Enriched Studies, and Serrania Charter For Enriched Studies.
Ownership History
Date
Name
Owned For
Owner Type
Purchase Details
Closed on
Feb 3, 2011
Sold by
Pershina Kristina
Bought by
Gathe Kamlesh
Current Estimated Value
Purchase Details
Closed on
Jan 7, 2010
Sold by
Gathe Kamlesh
Bought by
Pershina Kristina
Purchase Details
Closed on
Jul 20, 2009
Sold by
Selinger Carol Sue
Bought by
Gathe Kamlesh and Pershina Kristina
Home Financials for this Owner
Home Financials are based on the most recent Mortgage that was taken out on this home.
Original Mortgage
$451,668
Interest Rate
5.08%
Mortgage Type
FHA
Purchase Details
Closed on
Jul 31, 2006
Sold by
Selinger Carol Sue
Bought by
Selinger Carol Sue and Selinger Gail M
Purchase Details
Closed on
Jan 25, 1999
Sold by
Selinger Lawrence G and Selinger Esther
Bought by
Selinger Laurence G and The Selinger Family Trust
Create a Home Valuation Report for This Property
The Home Valuation Report is an in-depth analysis detailing your home's value as well as a comparison with similar homes in the area
Home Values in the Area
Average Home Value in this Area
Purchase History
| Date | Buyer | Sale Price | Title Company |
|---|---|---|---|
| Gathe Kamlesh | -- | None Available | |
| Pershina Kristina | -- | None Available | |
| Gathe Kamlesh | $460,000 | Chicago Title Company | |
| Selinger Carol Sue | -- | None Available | |
| Selinger Laurence G | -- | -- |
Source: Public Records
Mortgage History
| Date | Status | Borrower | Loan Amount |
|---|---|---|---|
| Previous Owner | Gathe Kamlesh | $451,668 |
Source: Public Records
Tax History Compared to Growth
Tax History
| Year | Tax Paid | Tax Assessment Tax Assessment Total Assessment is a certain percentage of the fair market value that is determined by local assessors to be the total taxable value of land and additions on the property. | Land | Improvement |
|---|---|---|---|---|
| 2025 | $7,466 | $613,718 | $358,722 | $254,996 |
| 2024 | $7,466 | $601,686 | $351,689 | $249,997 |
| 2023 | $7,323 | $589,890 | $344,794 | $245,096 |
| 2022 | $7,004 | $578,325 | $338,034 | $240,291 |
| 2021 | $6,913 | $566,986 | $331,406 | $235,580 |
| 2019 | $6,707 | $550,171 | $321,577 | $228,594 |
| 2018 | $6,621 | $539,384 | $315,272 | $224,112 |
| 2016 | $5,526 | $454,546 | $303,031 | $151,515 |
| 2015 | $5,446 | $447,720 | $298,480 | $149,240 |
| 2014 | $5,468 | $438,951 | $292,634 | $146,317 |
Source: Public Records
Map
Nearby Homes
- 22037 Ybarra Rd
- 22002 Ybarra Rd
- 22051 San Miguel St
- 4841 Don Pio Dr
- 22015 Independencia St
- 22218 San Miguel St
- 22025 De la Osa St
- 4944 Don Pio Dr
- 22263 Flanco Rd
- 21907 De la Osa St
- 4731 Topanga Canyon Blvd
- 22051 Mulholland Way
- 22261 Ybarra Rd
- 21914 Velicata St
- 4976 Llano Dr
- 4616 Coyle Place
- 22297 Buena Ventura St
- 4996 Llano Dr
- 4642 Santa Lucia Dr
- 5099 Llano Dr
- 22116 Viscanio Rd
- 22104 Viscanio Rd
- 22100 Viscanio Rd
- 22120 Viscanio Rd
- 22113 Buena Ventura St
- 22117 Buena Ventura St
- 22107 Buena Ventura St
- 22101 Buenaventura St
- 22126 Viscanio Rd
- 22056 Viscanio Rd
- 22101 Buena Ventura St
- 22123 Buena Ventura St
- 22111 Viscanio Rd
- 22105 Viscanio Rd
- 22117 Viscanio Rd
- 22127 Buena Ventura St
- 22057 Buena Ventura St
- 22101 Viscanio Rd
- 22130 Viscanio Rd
- 22050 Viscanio Rd