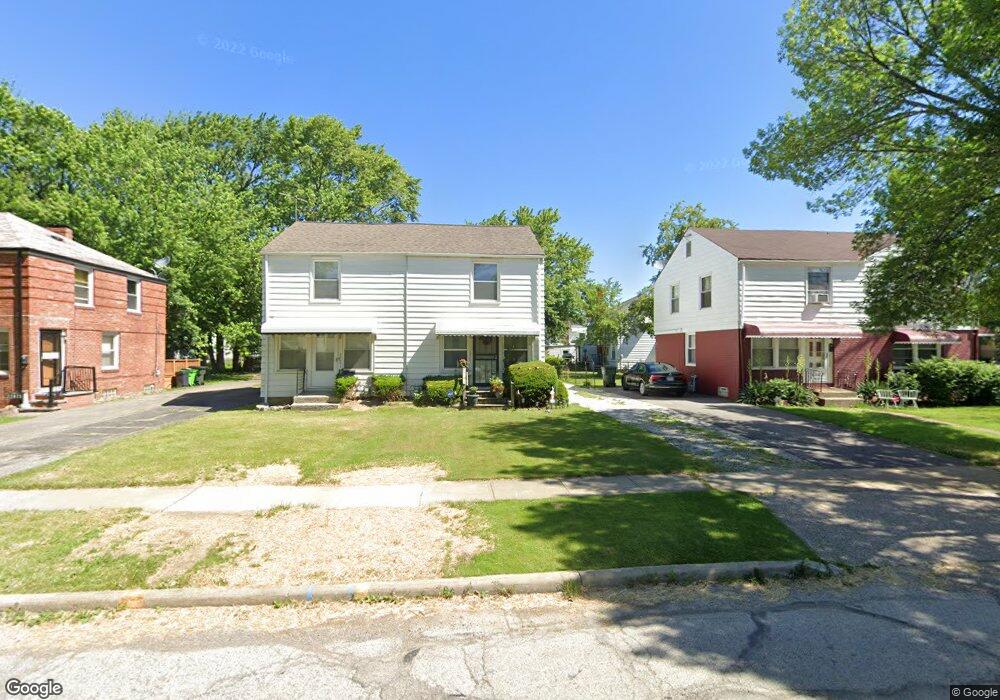
22111 Crystal Ave Euclid, OH 44123
Estimated Value: $56,000 - $75,000
2
Beds
1
Bath
858
Sq Ft
$80/Sq Ft
Est. Value
About This Home
This home is located at 22111 Crystal Ave, Euclid, OH 44123 and is currently estimated at $68,904, approximately $80 per square foot. 22111 Crystal Ave is a home located in Cuyahoga County with nearby schools including Arbor Elementary School, Euclid Middle School, and Euclid High School.
Ownership History
Date
Name
Owned For
Owner Type
Purchase Details
Closed on
Sep 18, 2019
Sold by
Werd Group Llc
Bought by
Jones Justin R
Current Estimated Value
Home Financials for this Owner
Home Financials are based on the most recent Mortgage that was taken out on this home.
Original Mortgage
$112,917
Outstanding Balance
$97,860
Interest Rate
3.62%
Mortgage Type
FHA
Estimated Equity
-$28,956
Purchase Details
Closed on
Sep 12, 2011
Sold by
Drew Daniel J
Bought by
Werd Group Llc
Purchase Details
Closed on
Mar 10, 2011
Sold by
Winkleman Harold A
Bought by
Drew Daniel J
Purchase Details
Closed on
Feb 16, 1988
Sold by
Harold A Winkleman
Bought by
Winkleman Harold A
Purchase Details
Closed on
May 27, 1981
Sold by
Winkleman Harold A and Winkleman Marie E
Bought by
Harold A Winkleman
Purchase Details
Closed on
Jan 1, 1975
Bought by
Winkleman Harold A and Winkleman Marie E
Create a Home Valuation Report for This Property
The Home Valuation Report is an in-depth analysis detailing your home's value as well as a comparison with similar homes in the area
Home Values in the Area
Average Home Value in this Area
Purchase History
| Date | Buyer | Sale Price | Title Company |
|---|---|---|---|
| Jones Justin R | $115,900 | Enterprise Title Agency Inc | |
| Werd Group Llc | -- | Enterprise Title Agency Inc | |
| Drew Daniel J | $15,000 | Enterprise Title Agency | |
| Winkleman Harold A | -- | -- | |
| Harold A Winkleman | -- | -- | |
| Winkleman Harold A | -- | -- |
Source: Public Records
Mortgage History
| Date | Status | Borrower | Loan Amount |
|---|---|---|---|
| Open | Jones Justin R | $112,917 |
Source: Public Records
Tax History
| Year | Tax Paid | Tax Assessment Tax Assessment Total Assessment is a certain percentage of the fair market value that is determined by local assessors to be the total taxable value of land and additions on the property. | Land | Improvement |
|---|---|---|---|---|
| 2025 | $1,612 | $22,750 | $7,000 | $15,750 |
| 2024 | $1,657 | $22,750 | $7,000 | $15,750 |
| 2023 | $1,241 | $13,170 | $5,500 | $7,670 |
| 2022 | $1,215 | $13,160 | $5,500 | $7,670 |
| 2021 | $1,343 | $13,160 | $5,500 | $7,670 |
| 2020 | $1,142 | $9,980 | $4,170 | $5,810 |
| 2019 | $1,022 | $28,500 | $11,900 | $16,600 |
| 2018 | $1,029 | $9,980 | $4,170 | $5,810 |
| 2017 | $925 | $7,360 | $2,770 | $4,590 |
| 2016 | $927 | $7,360 | $2,770 | $4,590 |
| 2015 | $852 | $7,360 | $2,770 | $4,590 |
| 2014 | $852 | $7,360 | $2,770 | $4,590 |
Source: Public Records
Map
Nearby Homes
- 21971 Crystal Ave
- 21670 Crystal Ave
- 442 Clearview Dr Unit U9
- 422 Clearview Dr Unit J10
- 421 Kenwood Dr Unit G
- 21481 Ball Ave
- 22751 Fox Ave
- 324 E 215th St
- 450 Kenwood Dr Unit D-12
- 521 Kenwood Dr Unit B-5
- 21051 S Lake Shore Blvd
- 461 Kenwood Dr Unit T3
- 285 E 216th St
- 21000 Crystal Ave
- 21181 Ball Ave
- 20931 Priday Ave
- 336 E 222nd St
- 20900 Priday Ave
- 273 E 208th St
- 21250 Wilmore Ave
- 22091 Crystal Ave
- 22131 Crystal Ave
- 22071 Crystal Ave
- 564 E 222nd St
- 568 E 222nd St
- 22051 Crystal Ave
- 560 E 222nd St
- 22031 Crystal Ave
- 22110 S Lake Shore Blvd
- 22090 S Lake Shore Blvd
- 22070 S Lake Shore Blvd
- 22011 Crystal Ave
- 22130 S Lake Shore Blvd
- 22050 S Lake Shore Blvd
- 558 E 222nd St
- 21991 Crystal Ave
- 22030 S Lake Shore Blvd
- 22090 Crystal Ave
- 22110 Crystal Ave
- 22070 Crystal Ave
Your Personal Tour Guide
Ask me questions while you tour the home.