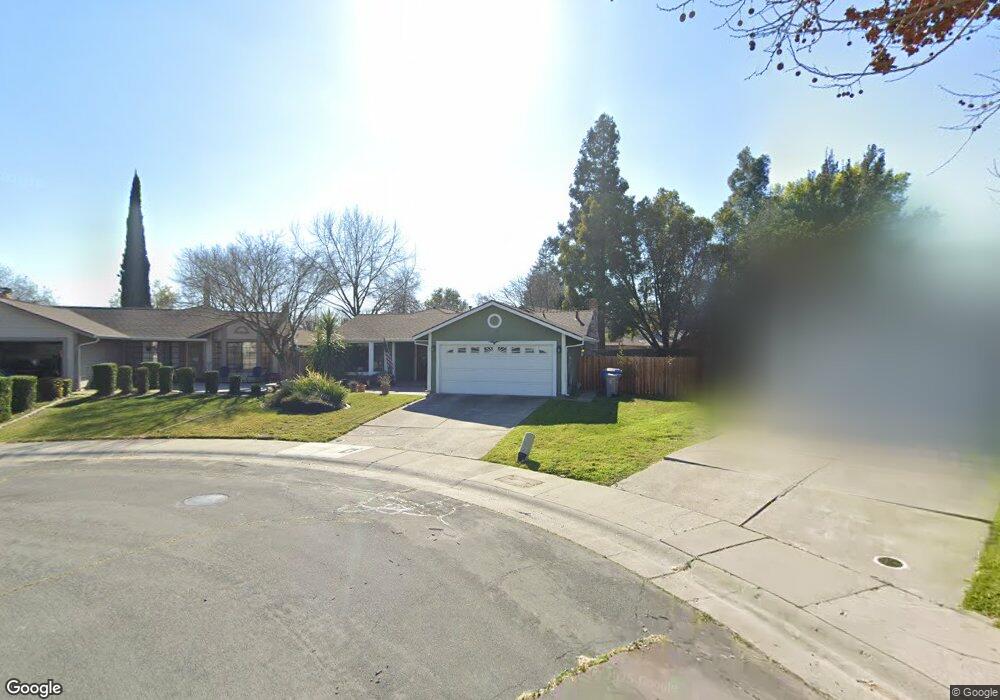
2212 Atrisco Cir Sacramento, CA 95833
Frates Ranch NeighborhoodEstimated Value: $479,000 - $495,000
4
Beds
2
Baths
1,484
Sq Ft
$326/Sq Ft
Est. Value
About This Home
This home is located at 2212 Atrisco Cir, Sacramento, CA 95833 and is currently estimated at $483,889, approximately $326 per square foot. 2212 Atrisco Cir is a home located in Sacramento County with nearby schools including Jefferson Elementary School, Natomas High School, and READ Academy of Sacramento.
Ownership History
Date
Name
Owned For
Owner Type
Purchase Details
Closed on
Aug 23, 2013
Sold by
Delle Mark D
Bought by
Griffin Ralph and Griffin Dana
Current Estimated Value
Home Financials for this Owner
Home Financials are based on the most recent Mortgage that was taken out on this home.
Original Mortgage
$188,977
Outstanding Balance
$139,859
Interest Rate
4.27%
Mortgage Type
VA
Estimated Equity
$344,030
Purchase Details
Closed on
Dec 20, 2004
Sold by
Hobson Katherine D
Bought by
Delle Mark D
Home Financials for this Owner
Home Financials are based on the most recent Mortgage that was taken out on this home.
Original Mortgage
$193,000
Interest Rate
5.74%
Mortgage Type
New Conventional
Purchase Details
Closed on
Jun 15, 2001
Sold by
Hobson Katherine D and Delle Katherine D
Bought by
Hobson Katherine D
Home Financials for this Owner
Home Financials are based on the most recent Mortgage that was taken out on this home.
Original Mortgage
$112,000
Interest Rate
7.15%
Create a Home Valuation Report for This Property
The Home Valuation Report is an in-depth analysis detailing your home's value as well as a comparison with similar homes in the area
Home Values in the Area
Average Home Value in this Area
Purchase History
| Date | Buyer | Sale Price | Title Company |
|---|---|---|---|
| Griffin Ralph | $185,000 | Fidelity National Title Co | |
| Delle Mark D | $330,000 | Financial Title Company | |
| Hobson Katherine D | -- | Alliance Title Company |
Source: Public Records
Mortgage History
| Date | Status | Borrower | Loan Amount |
|---|---|---|---|
| Open | Griffin Ralph | $188,977 | |
| Closed | Griffin Ralph | $188,977 | |
| Previous Owner | Delle Mark D | $193,000 | |
| Previous Owner | Hobson Katherine D | $112,000 |
Source: Public Records
Tax History Compared to Growth
Tax History
| Year | Tax Paid | Tax Assessment Tax Assessment Total Assessment is a certain percentage of the fair market value that is determined by local assessors to be the total taxable value of land and additions on the property. | Land | Improvement |
|---|---|---|---|---|
| 2025 | $3,180 | $226,774 | $44,984 | $181,790 |
| 2024 | $3,180 | $222,328 | $44,102 | $178,226 |
| 2023 | $3,016 | $217,970 | $43,238 | $174,732 |
| 2022 | $2,950 | $213,697 | $42,391 | $171,306 |
| 2021 | $2,966 | $209,508 | $41,560 | $167,948 |
| 2020 | $2,965 | $207,360 | $41,134 | $166,226 |
| 2019 | $2,921 | $203,295 | $40,328 | $162,967 |
| 2018 | $2,818 | $199,310 | $39,538 | $159,772 |
| 2017 | $2,753 | $195,403 | $38,763 | $156,640 |
| 2016 | $2,703 | $191,572 | $38,003 | $153,569 |
| 2015 | $2,631 | $188,696 | $37,433 | $151,263 |
| 2014 | $2,494 | $185,000 | $36,700 | $148,300 |
Source: Public Records
Map
Nearby Homes
- 2897 Candido Dr
- 2872 Baronet Way
- 30 Cedro Cir
- 2866 Roseau Way
- 3241 Tice Creek Way
- 1763 Bridgecreek Dr
- 26 Rosier Cir
- 2511 Aimonetti Ave
- 3044 Spoonwood Way
- 3028 Spoonwood Way
- 3150 Spoonwood Way
- 2580 W El Camino Ave Unit 11103
- 2580 W El Camino Ave Unit 10105
- 3139 Torland St
- 1738 Bannon Creek Dr
- 2816 Earthened Walk
- 600 Del Verde Cir Unit 2
- 100 Del Verde Cir Unit 4
- 350 Del Verde Cir Unit 6
- 3142 Buchman St
- 2208 Atrisco Cir
- 2216 Atrisco Cir
- 2225 Coroval Dr
- 2227 Coroval Dr
- 2229 Coroval Dr
- 2204 Atrisco Cir
- 2223 Coroval Dr
- 2213 Coroval Dr
- 2231 Coroval Dr
- 2219 Atrisco Cir
- 2213 Atrisco Cir
- 2221 Coroval Dr
- 2200 Atrisco Cir
- 2209 Coroval Dr
- 2209 Atrisco Cir
- 2233 Coroval Dr
- 2207 Coroval Dr
- 2196 Atrisco Cir
- 2205 Atrisco Cir