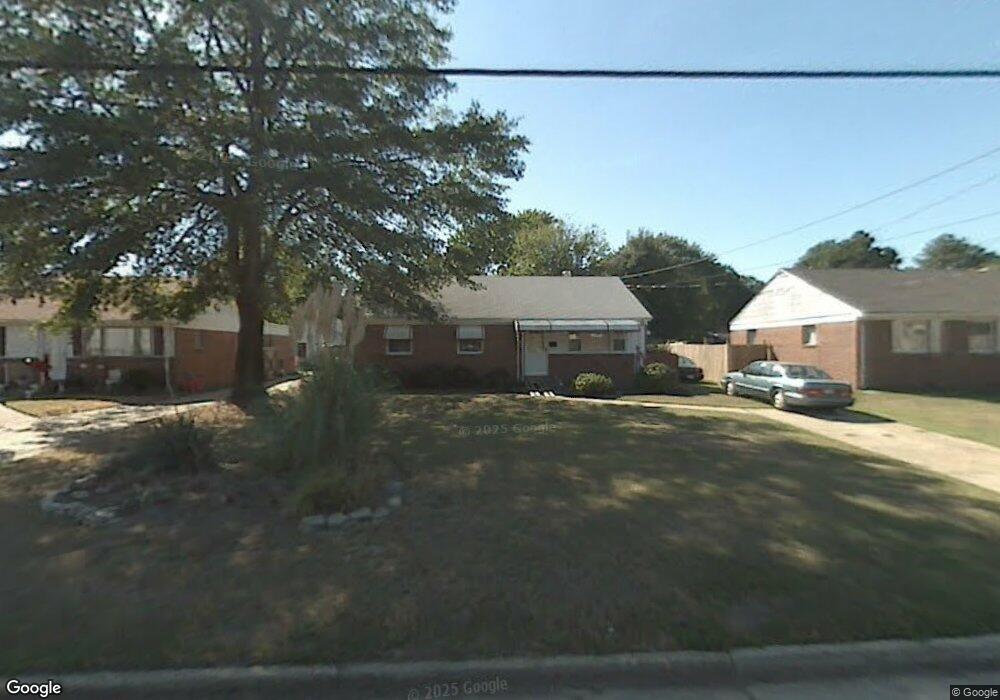
2212 Chesapeake Ave Chesapeake, VA 23324
South Norfolk NeighborhoodEstimated Value: $279,000 - $319,000
3
Beds
2
Baths
1,218
Sq Ft
$250/Sq Ft
Est. Value
About This Home
This home is located at 2212 Chesapeake Ave, Chesapeake, VA 23324 and is currently estimated at $304,762, approximately $250 per square foot. 2212 Chesapeake Ave is a home located in Chesapeake City with nearby schools including Portlock Primary School, George W. Carver Intermediate School, and Oscar Smith Middle School.
Ownership History
Date
Name
Owned For
Owner Type
Purchase Details
Closed on
Jun 1, 2023
Sold by
Cunningham Cassi D
Bought by
Johnson Deborah T
Current Estimated Value
Purchase Details
Closed on
Jun 8, 2020
Sold by
Home Investments Inc
Bought by
Cunningham Cassi D
Home Financials for this Owner
Home Financials are based on the most recent Mortgage that was taken out on this home.
Original Mortgage
$188,180
Interest Rate
3.3%
Mortgage Type
New Conventional
Purchase Details
Closed on
Oct 23, 2019
Sold by
Us Bank Na
Bought by
Home Investments Inc
Home Financials for this Owner
Home Financials are based on the most recent Mortgage that was taken out on this home.
Original Mortgage
$115,400
Interest Rate
3.7%
Mortgage Type
Commercial
Purchase Details
Closed on
Apr 5, 2019
Sold by
Professional Foreclosure Corporation Of
Bought by
Us Bank Na and The Csmc Mortgage-Backed Pass-Through Ce
Create a Home Valuation Report for This Property
The Home Valuation Report is an in-depth analysis detailing your home's value as well as a comparison with similar homes in the area
Home Values in the Area
Average Home Value in this Area
Purchase History
| Date | Buyer | Sale Price | Title Company |
|---|---|---|---|
| Johnson Deborah T | $281,500 | Fidelity National Title | |
| Cunningham Cassi D | $194,000 | Linear Title & Escrow Llc | |
| Home Investments Inc | $106,616 | Servicelink Llc | |
| Us Bank Na | $133,200 | None Available |
Source: Public Records
Mortgage History
| Date | Status | Borrower | Loan Amount |
|---|---|---|---|
| Previous Owner | Cunningham Cassi D | $188,180 | |
| Previous Owner | Home Investments Inc | $115,400 |
Source: Public Records
Tax History
| Year | Tax Paid | Tax Assessment Tax Assessment Total Assessment is a certain percentage of the fair market value that is determined by local assessors to be the total taxable value of land and additions on the property. | Land | Improvement |
|---|---|---|---|---|
| 2025 | $2,635 | $271,100 | $110,000 | $161,100 |
| 2024 | $2,635 | $260,900 | $100,000 | $160,900 |
| 2023 | $1,977 | $216,600 | $90,000 | $126,600 |
| 2022 | $1,959 | $194,000 | $80,000 | $114,000 |
| 2021 | $1,801 | $171,500 | $65,000 | $106,500 |
| 2020 | $1,752 | $166,900 | $65,000 | $101,900 |
| 2019 | $1,497 | $142,600 | $60,000 | $82,600 |
| 2018 | $1,562 | $148,800 | $60,000 | $88,800 |
| 2017 | $1,519 | $144,700 | $60,000 | $84,700 |
| 2016 | $1,493 | $142,200 | $60,000 | $82,200 |
| 2015 | $1,493 | $142,200 | $60,000 | $82,200 |
| 2014 | $1,493 | $142,200 | $60,000 | $82,200 |
Source: Public Records
Map
Nearby Homes
- 2220 Rodgers St
- 1905 Chesapeake Ave
- 1714 Seaboard Ave
- 824 Post Ave
- 807 Wright Ave
- 712 Post Ave
- 1+ac Wilton St
- 1929 Martin Ave
- 1216 Holly Ave
- 103 Swain Ave
- 1819 Martin Ave
- 1437 Chesapeake Ave
- 1007 Holly Ave
- 1302 Park Ave
- 1337 Chesapeake Ave
- 1832 Elizabeth Ave
- 1317 Seaboard Ave
- 1308 Chesapeake Ave
- 1322 Hoover Ave
- 1308 Seaboard Ave
- 2216 Chesapeake Ave
- 2208 Chesapeake Ave
- 2220 Chesapeake Ave
- 2204 Chesapeake Ave
- 2213 Chesapeake Ave
- 2209 Chesapeake Ave
- 2213 Haywood Ave
- 2217 Chesapeake Ave
- 2224 Chesapeake Ave
- 2217 Haywood Ave
- 2205 Chesapeake Ave
- 1312 Able St
- 2209 Haywood Ave
- 1308 Able St
- 2205 Haywood Ave
- 2221 Haywood Ave
- 2201 Chesapeake Ave
- 2225 Chesapeake Ave
- 2225 Haywood Ave
- 1304 Able St
Your Personal Tour Guide
Ask me questions while you tour the home.