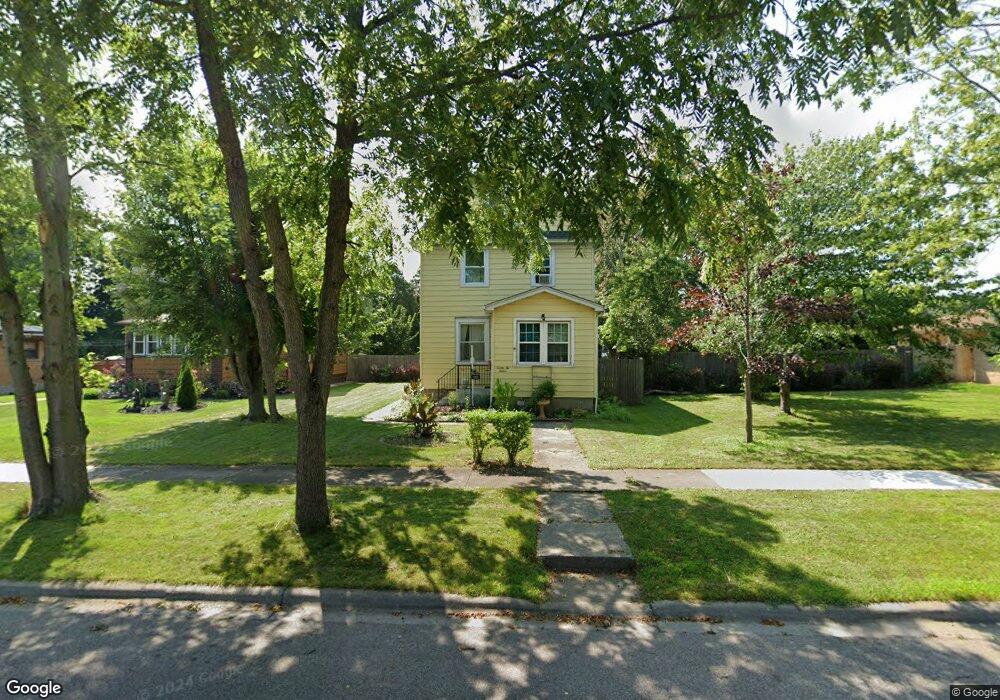
2212 Gideon Ave Zion, IL 60099
Central Zion NeighborhoodEstimated Value: $324,000 - $372,000
4
Beds
2
Baths
2,300
Sq Ft
$152/Sq Ft
Est. Value
About This Home
This home is located at 2212 Gideon Ave, Zion, IL 60099 and is currently estimated at $349,206, approximately $151 per square foot. 2212 Gideon Ave is a home located in Lake County with nearby schools including Shiloh Park Middle School, Zion Central Middle School, and Zion-Benton Township High School.
Ownership History
Date
Name
Owned For
Owner Type
Purchase Details
Closed on
May 12, 2011
Sold by
Zaragoza Jose F
Bought by
Garcia Javier and Diaz Leticia
Current Estimated Value
Purchase Details
Closed on
Mar 7, 2007
Sold by
Offermann Douglas E and Offermann Crystal J
Bought by
Zaragoza Jose F
Home Financials for this Owner
Home Financials are based on the most recent Mortgage that was taken out on this home.
Original Mortgage
$151,000
Interest Rate
6.27%
Mortgage Type
Unknown
Purchase Details
Closed on
May 24, 2001
Sold by
Haworth Dale Richard and Haworth Roberta A
Bought by
Offermann Douglas E and Offermann Crystal J
Home Financials for this Owner
Home Financials are based on the most recent Mortgage that was taken out on this home.
Original Mortgage
$127,300
Interest Rate
7.11%
Create a Home Valuation Report for This Property
The Home Valuation Report is an in-depth analysis detailing your home's value as well as a comparison with similar homes in the area
Home Values in the Area
Average Home Value in this Area
Purchase History
| Date | Buyer | Sale Price | Title Company |
|---|---|---|---|
| Garcia Javier | $32,500 | None Available | |
| Zaragoza Jose F | $151,000 | Attorneys Title Guaranty Fun | |
| Offermann Douglas E | $134,000 | Burnet Title Llc |
Source: Public Records
Mortgage History
| Date | Status | Borrower | Loan Amount |
|---|---|---|---|
| Previous Owner | Zaragoza Jose F | $151,000 | |
| Previous Owner | Offermann Douglas E | $127,300 |
Source: Public Records
Tax History Compared to Growth
Tax History
| Year | Tax Paid | Tax Assessment Tax Assessment Total Assessment is a certain percentage of the fair market value that is determined by local assessors to be the total taxable value of land and additions on the property. | Land | Improvement |
|---|---|---|---|---|
| 2024 | $11,003 | $98,234 | $7,613 | $90,621 |
| 2023 | $10,468 | $87,584 | $6,788 | $80,796 |
| 2022 | $10,468 | $79,235 | $5,591 | $73,644 |
| 2021 | $9,980 | $69,259 | $5,243 | $64,016 |
| 2020 | $9,000 | $60,722 | $4,931 | $55,791 |
| 2019 | $8,649 | $56,564 | $4,593 | $51,971 |
| 2018 | $5,936 | $39,870 | $4,174 | $35,696 |
| 2017 | $5,916 | $36,985 | $3,872 | $33,113 |
| 2016 | $5,505 | $33,574 | $3,515 | $30,059 |
| 2015 | $5,249 | $30,463 | $3,189 | $27,274 |
| 2014 | $1,165 | $5,494 | $3,072 | $2,422 |
| 2012 | $995 | $5,851 | $3,272 | $2,579 |
Source: Public Records
Map
Nearby Homes
- 1930 23rd St
- 2318 Gideon Ave
- 2031 Gilboa Ave
- 2037 Gabriel Ave
- 2409 Gilboa Ave
- 2217 20th St
- 2301 Hermon Ave
- 2311 Horeb Ave
- 2406 Hermon Ave
- 2703 21st St
- 2609 Gilboa Ave
- 2217 Joanna Ave
- 2101 Eshcol Ave
- 1718 Gilboa Ave
- 2204 Joanna Ave
- 2313 Joppa Ave
- 2322 Joppa Ave
- 1701 Galilee Ave
- 10702 W 17th St
- 2720 Gilboa Ave
- 2214 Gideon Ave
- 2208 Gideon Ave
- 2216 Gideon Ave
- 2220 Gideon Ave
- 2206 Gideon Ave
- 2213 Gilboa Ave
- 2211 Gilboa Ave
- 2217 Gilboa Ave
- 2213 Gideon Ave
- 2209 Gilboa Ave
- 2215 Gideon Ave
- 2219 Gilboa Ave
- 2207 Gilboa Ave
- 2200 Gideon Ave
- 2217 Gideon Ave
- 2300 Gideon Ave
- 2205 Gilboa Ave
- 2219 Gideon Ave
- 2203 Gilboa Ave
- 2302 Gideon Ave