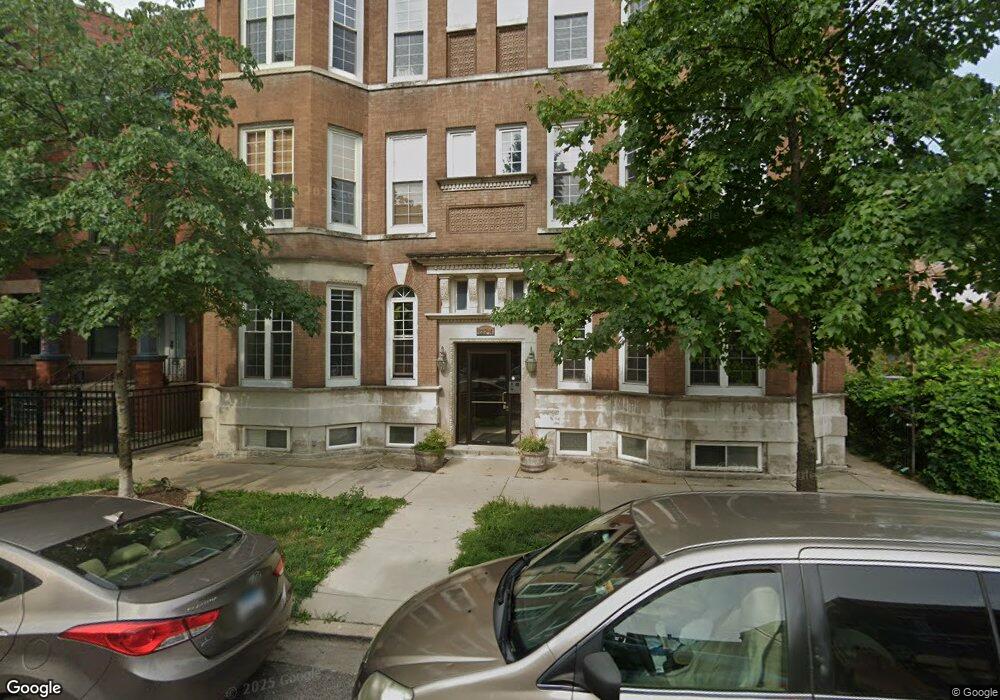
2212 N Campbell Ave Unit 1A Chicago, IL 60647
Logan Square NeighborhoodEstimated Value: $424,000 - $658,000
3
Beds
3
Baths
1,600
Sq Ft
$341/Sq Ft
Est. Value
About This Home
This home is located at 2212 N Campbell Ave Unit 1A, Chicago, IL 60647 and is currently estimated at $545,340, approximately $340 per square foot. 2212 N Campbell Ave Unit 1A is a home located in Cook County with nearby schools including Goethe Elementary School, Clemente Community Academy High School, and CICS - Bucktown Campus.
Ownership History
Date
Name
Owned For
Owner Type
Purchase Details
Closed on
Feb 25, 2023
Sold by
Isunza Rene Ruiz
Bought by
Isunza Rene Ruis and Isunza Kyle
Current Estimated Value
Purchase Details
Closed on
Nov 18, 2022
Sold by
Gonzalez Francisco
Bought by
Isunza Rene
Home Financials for this Owner
Home Financials are based on the most recent Mortgage that was taken out on this home.
Original Mortgage
$353,400
Interest Rate
6.88%
Mortgage Type
New Conventional
Purchase Details
Closed on
Feb 27, 2009
Sold by
2212-14 Campbell Development Llc
Bought by
Gonzalez Francisco and Gonzalez Marcelino
Home Financials for this Owner
Home Financials are based on the most recent Mortgage that was taken out on this home.
Original Mortgage
$186,875
Interest Rate
5.09%
Mortgage Type
Purchase Money Mortgage
Create a Home Valuation Report for This Property
The Home Valuation Report is an in-depth analysis detailing your home's value as well as a comparison with similar homes in the area
Home Values in the Area
Average Home Value in this Area
Purchase History
| Date | Buyer | Sale Price | Title Company |
|---|---|---|---|
| Isunza Rene Ruis | -- | None Listed On Document | |
| Isunza Rene | $372,000 | None Listed On Document | |
| Gonzalez Francisco | $287,500 | Chicago Title Insurance Co |
Source: Public Records
Mortgage History
| Date | Status | Borrower | Loan Amount |
|---|---|---|---|
| Previous Owner | Isunza Rene | $353,400 | |
| Previous Owner | Gonzalez Francisco | $186,875 |
Source: Public Records
Tax History Compared to Growth
Tax History
| Year | Tax Paid | Tax Assessment Tax Assessment Total Assessment is a certain percentage of the fair market value that is determined by local assessors to be the total taxable value of land and additions on the property. | Land | Improvement |
|---|---|---|---|---|
| 2024 | $7,238 | $44,956 | $4,312 | $40,644 |
| 2023 | $7,033 | $37,498 | $1,963 | $35,535 |
| 2022 | $7,033 | $37,498 | $1,963 | $35,535 |
| 2021 | $6,893 | $37,498 | $1,963 | $35,535 |
| 2020 | $7,604 | $37,113 | $1,963 | $35,150 |
| 2019 | $7,585 | $41,046 | $1,963 | $39,083 |
| 2018 | $7,429 | $41,046 | $1,963 | $39,083 |
| 2017 | $5,491 | $28,882 | $1,732 | $27,150 |
| 2016 | $5,285 | $28,882 | $1,732 | $27,150 |
| 2015 | $4,812 | $28,882 | $1,732 | $27,150 |
| 2014 | $4,741 | $28,121 | $1,559 | $26,562 |
| 2013 | $4,636 | $28,121 | $1,559 | $26,562 |
Source: Public Records
Map
Nearby Homes
- 2531 W Lyndale St
- 2735 N Campbell Ave
- 2535 W Belden Ave
- 2574 W Lyndale St Unit 2
- 2578 W Lyndale St Unit 2
- 2418 W Charleston St
- 2515 W Charleston St
- 2168 N Rockwell St
- 2546 W Medill Ave
- 2301 N Rockwell St Unit 3
- 2423 W Fullerton Ave Unit 4G
- 2429-2431 W Fullerton Ave
- 2413 W Fullerton Ave Unit 3
- 2139 N Bingham St
- 2208 N Oakley Ave Unit 1N
- 2320 W Charleston St
- 2118 N Bingham St
- 2056 N Bingham St
- 2650 W Belden Ave Unit 207
- 2147 N Bingham St
- 2214 N Campbell Ave Unit 1A
- 2214 N Campbell Ave Unit 1B
- 2214 N Campbell Ave Unit P3
- 2214 N Campbell Ave Unit P2
- 2214 N Campbell Ave Unit P1
- 2214 N Campbell Ave Unit 3D
- 2214 N Campbell Ave Unit 3C
- 2214 N Campbell Ave Unit 3B
- 2214 N Campbell Ave Unit 2D
- 2214 N Campbell Ave Unit 2C
- 2214 N Campbell Ave Unit 2B
- 2214 N Campbell Ave Unit 2A
- 2214 N Campbell Ave Unit 1D
- 2214 N Campbell Ave Unit 1C
- 2214 N Campbell Ave Unit P5
- 2214 N Campbell Ave Unit P4
- 2212 N Campbell Ave Unit 3A
- 2212 N Campbell Ave Unit 3D
- 2212 N Campbell Ave Unit G
- 2212 N Campbell Ave Unit 1S