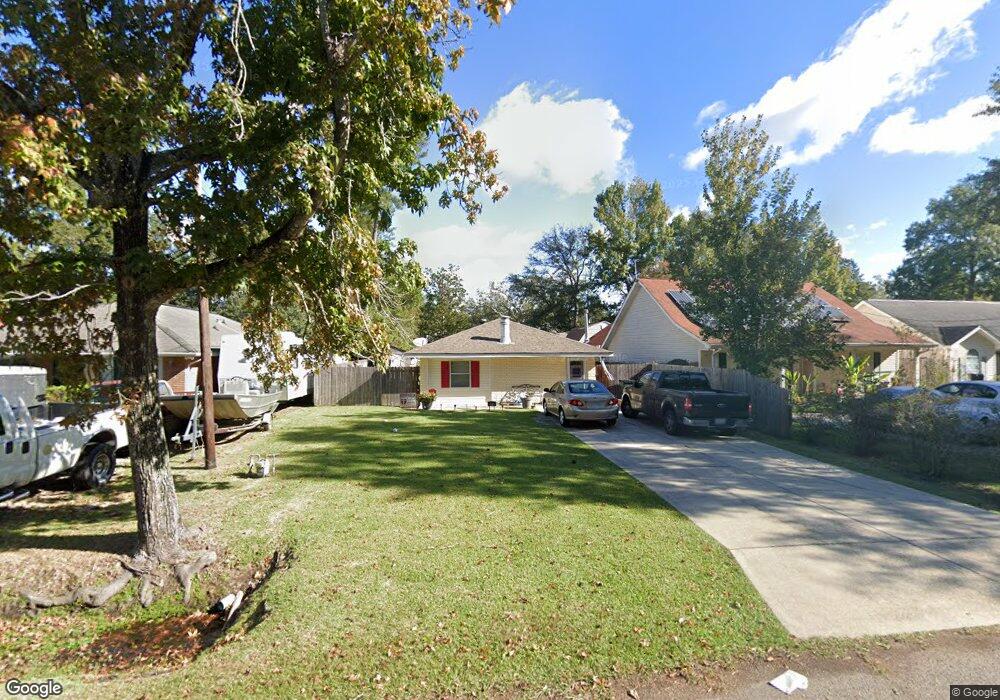
2212 Robin St Slidell, LA 70460
Estimated Value: $168,000 - $182,000
3
Beds
2
Baths
1,482
Sq Ft
$117/Sq Ft
Est. Value
About This Home
This home is located at 2212 Robin St, Slidell, LA 70460 and is currently estimated at $173,200, approximately $116 per square foot. 2212 Robin St is a home located in St. Tammany Parish with nearby schools including Henry Mayfield Elementary School, Slidell Junior High School, and Slidell High School.
Ownership History
Date
Name
Owned For
Owner Type
Purchase Details
Closed on
Aug 3, 2010
Sold by
Beyer Charles R and Beyer Sylvia Mosteiro
Bought by
Mese Shannon Schulingkamp and Mese Michael Joseph
Current Estimated Value
Home Financials for this Owner
Home Financials are based on the most recent Mortgage that was taken out on this home.
Original Mortgage
$127,551
Outstanding Balance
$82,659
Interest Rate
4.54%
Mortgage Type
New Conventional
Estimated Equity
$90,541
Create a Home Valuation Report for This Property
The Home Valuation Report is an in-depth analysis detailing your home's value as well as a comparison with similar homes in the area
Home Values in the Area
Average Home Value in this Area
Purchase History
| Date | Buyer | Sale Price | Title Company |
|---|---|---|---|
| Mese Shannon Schulingkamp | $125,000 | Bayou Title Inc |
Source: Public Records
Mortgage History
| Date | Status | Borrower | Loan Amount |
|---|---|---|---|
| Open | Mese Shannon Schulingkamp | $127,551 |
Source: Public Records
Tax History
| Year | Tax Paid | Tax Assessment Tax Assessment Total Assessment is a certain percentage of the fair market value that is determined by local assessors to be the total taxable value of land and additions on the property. | Land | Improvement |
|---|---|---|---|---|
| 2025 | $441 | $10,703 | $2,250 | $8,453 |
| 2024 | $441 | $10,703 | $2,250 | $8,453 |
| 2023 | $458 | $7,800 | $1,500 | $6,300 |
| 2022 | $8,272 | $7,800 | $1,500 | $6,300 |
| 2021 | $83 | $7,800 | $1,500 | $6,300 |
| 2020 | $82 | $7,800 | $1,500 | $6,300 |
| 2019 | $1,147 | $7,380 | $750 | $6,630 |
| 2018 | $1,151 | $7,380 | $750 | $6,630 |
| 2017 | $1,158 | $7,380 | $750 | $6,630 |
| 2016 | $1,185 | $7,380 | $750 | $6,630 |
| 2015 | $39 | $7,450 | $1,600 | $5,850 |
| 2014 | $39 | $7,450 | $1,600 | $5,850 |
| 2013 | -- | $7,450 | $1,600 | $5,850 |
Source: Public Records
Map
Nearby Homes
Your Personal Tour Guide
Ask me questions while you tour the home.