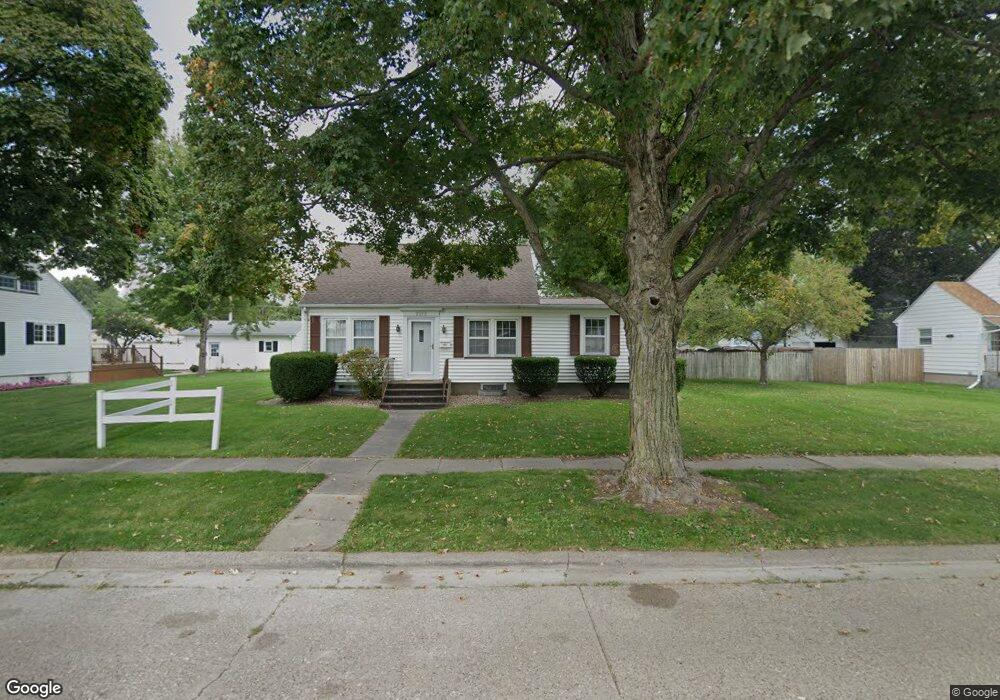
2212 S 13th St Burlington, IA 52601
Estimated Value: $146,270 - $168,000
4
Beds
2
Baths
1,638
Sq Ft
$95/Sq Ft
Est. Value
About This Home
This home is located at 2212 S 13th St, Burlington, IA 52601 and is currently estimated at $155,818, approximately $95 per square foot. 2212 S 13th St is a home located in Des Moines County with nearby schools including Burlington Community High School, Great River Christian School, and Burlington Notre Dame Catholic Elementary School.
Ownership History
Date
Name
Owned For
Owner Type
Purchase Details
Closed on
Aug 10, 2023
Sold by
Feehan Wendy and Feehan Craig B
Bought by
Jjj Rental Properties Llc
Current Estimated Value
Purchase Details
Closed on
Mar 21, 2023
Sold by
Reusch John Charles
Bought by
Feehan Wendy
Purchase Details
Closed on
Mar 8, 2023
Sold by
Reusch John Charles
Bought by
Feehan Wendy
Purchase Details
Closed on
Dec 29, 2015
Sold by
Miller Wendy
Bought by
Reusch John
Create a Home Valuation Report for This Property
The Home Valuation Report is an in-depth analysis detailing your home's value as well as a comparison with similar homes in the area
Home Values in the Area
Average Home Value in this Area
Purchase History
| Date | Buyer | Sale Price | Title Company |
|---|---|---|---|
| Jjj Rental Properties Llc | $135,000 | None Listed On Document | |
| Feehan Wendy | -- | -- | |
| Feehan Wendy | -- | -- | |
| Reusch John | -- | None Available |
Source: Public Records
Tax History Compared to Growth
Tax History
| Year | Tax Paid | Tax Assessment Tax Assessment Total Assessment is a certain percentage of the fair market value that is determined by local assessors to be the total taxable value of land and additions on the property. | Land | Improvement |
|---|---|---|---|---|
| 2025 | $2,536 | $139,300 | $16,200 | $123,100 |
| 2024 | $2,536 | $130,500 | $16,200 | $114,300 |
| 2023 | $2,360 | $130,500 | $16,200 | $114,300 |
| 2022 | $2,396 | $117,700 | $16,200 | $101,500 |
| 2021 | $2,396 | $117,700 | $16,200 | $101,500 |
| 2020 | $2,554 | $117,700 | $16,200 | $101,500 |
| 2019 | $2,218 | $117,700 | $16,200 | $101,500 |
| 2018 | $2,222 | $96,400 | $16,100 | $80,300 |
| 2017 | $2,222 | $94,800 | $0 | $0 |
| 2016 | $2,158 | $94,800 | $0 | $0 |
| 2015 | $2,158 | $94,800 | $0 | $0 |
| 2014 | $1,986 | $88,000 | $0 | $0 |
Source: Public Records
Map
Nearby Homes