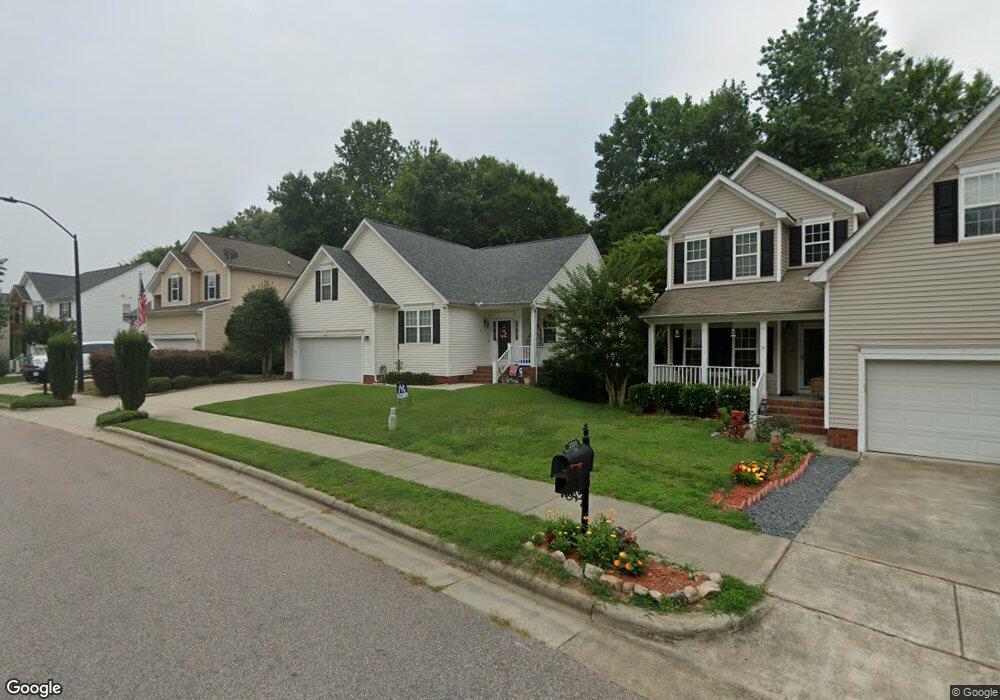
2212 Spruce Shadows Ln Raleigh, NC 27614
Falls Lake NeighborhoodEstimated Value: $402,000 - $431,000
3
Beds
2
Baths
1,810
Sq Ft
$228/Sq Ft
Est. Value
About This Home
This home is located at 2212 Spruce Shadows Ln, Raleigh, NC 27614 and is currently estimated at $413,394, approximately $228 per square foot. 2212 Spruce Shadows Ln is a home located in Wake County with nearby schools including Wakefield Elementary School, Wakefield Middle, and Wakefield High School.
Ownership History
Date
Name
Owned For
Owner Type
Purchase Details
Closed on
Dec 31, 2009
Sold by
Jordan Todd S and Jordan Kendall E
Bought by
Goccia William and Goccia Sharon
Current Estimated Value
Home Financials for this Owner
Home Financials are based on the most recent Mortgage that was taken out on this home.
Original Mortgage
$59,000
Interest Rate
4.33%
Mortgage Type
New Conventional
Purchase Details
Closed on
Jun 10, 2005
Sold by
Gage Gary C and Gage Judith A
Bought by
Jordan Todd S and Jordan Kendall E
Home Financials for this Owner
Home Financials are based on the most recent Mortgage that was taken out on this home.
Original Mortgage
$30,750
Interest Rate
5.27%
Mortgage Type
Stand Alone Second
Purchase Details
Closed on
Nov 16, 2001
Sold by
Landmark Homes Inc
Bought by
Gage Gary C and Gage Judith A
Home Financials for this Owner
Home Financials are based on the most recent Mortgage that was taken out on this home.
Original Mortgage
$25,000
Interest Rate
6.57%
Create a Home Valuation Report for This Property
The Home Valuation Report is an in-depth analysis detailing your home's value as well as a comparison with similar homes in the area
Home Values in the Area
Average Home Value in this Area
Purchase History
| Date | Buyer | Sale Price | Title Company |
|---|---|---|---|
| Goccia William | $212,000 | None Available | |
| Jordan Todd S | $205,000 | -- | |
| Gage Gary C | $190,000 | -- |
Source: Public Records
Mortgage History
| Date | Status | Borrower | Loan Amount |
|---|---|---|---|
| Closed | Goccia William | $59,000 | |
| Previous Owner | Jordan Todd S | $30,750 | |
| Previous Owner | Jordan Todd S | $164,000 | |
| Previous Owner | Gage Gary C | $25,000 |
Source: Public Records
Tax History Compared to Growth
Tax History
| Year | Tax Paid | Tax Assessment Tax Assessment Total Assessment is a certain percentage of the fair market value that is determined by local assessors to be the total taxable value of land and additions on the property. | Land | Improvement |
|---|---|---|---|---|
| 2025 | $3,419 | $389,782 | $120,000 | $269,782 |
| 2024 | $3,405 | $389,782 | $120,000 | $269,782 |
| 2023 | $2,823 | $257,168 | $53,000 | $204,168 |
| 2022 | $2,624 | $257,168 | $53,000 | $204,168 |
| 2021 | $2,522 | $257,168 | $53,000 | $204,168 |
| 2020 | $2,476 | $257,168 | $53,000 | $204,168 |
| 2019 | $2,486 | $212,745 | $40,000 | $172,745 |
| 2018 | $2,344 | $212,745 | $40,000 | $172,745 |
| 2017 | $2,233 | $212,745 | $40,000 | $172,745 |
| 2016 | $2,187 | $212,745 | $40,000 | $172,745 |
| 2015 | -- | $229,265 | $55,000 | $174,265 |
| 2014 | $2,271 | $229,265 | $55,000 | $174,265 |
Source: Public Records
Map
Nearby Homes
- 2220 Spruce Shadows Ln
- 13201 Townfield Dr
- 2536 Bent Green St
- 2561 Bent Green St
- 2116 Covered Bridge Ct
- 2738 Garden Knoll Ln
- 2545 Forest Shadows Ln
- 2822 Winter Song Rd
- 10701 Royal Forrest Dr
- 12204 Kaysmount Ct
- 3220 Queensland Rd
- 2704 Snowy Meadow Ct
- 3428 van Hessen Dr
- 3328 Queensland Rd
- 12301 Corvus Rd
- 2201 Wide River Dr
- 3436 Falls River Ave
- 12400 Village Gate Way
- 1500 River Mill Dr Unit 110
- 12412 Fieldmist Dr
- 2216 Spruce Shadows Ln
- 2208 Spruce Shadows Ln
- 2204 Spruce Shadows Ln
- 2213 Spruce Shadows Ln
- 2224 Spruce Shadows Ln
- 2217 Spruce Shadows Ln
- 2401 Springfield Park Dr
- 2221 Spruce Shadows Ln
- 2228 Spruce Shadows Ln
- 2225 Spruce Shadows Ln
- 2404 Springfield Park Dr
- 2405 Springfield Park Dr
- 2232 Spruce Shadows Ln
- 2229 Spruce Shadows Ln
- 2408 Springfield Park Dr
- 2409 Springfield Park Dr
- 2208 Bay Creek Ct
- 2429 Stately Oaks Dr
- 2425 Stately Oaks Dr
- 2233 Spruce Shadows Ln