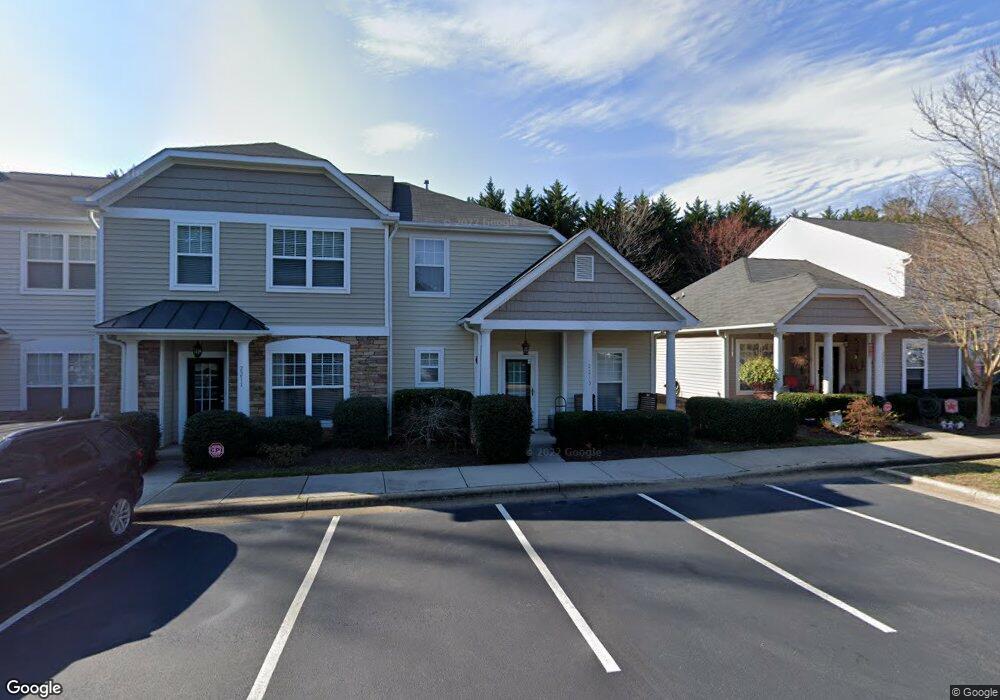
2213 Bankshill Row Raleigh, NC 27614
Falls River NeighborhoodEstimated Value: $323,049 - $346,000
3
Beds
3
Baths
1,422
Sq Ft
$234/Sq Ft
Est. Value
About This Home
This home is located at 2213 Bankshill Row, Raleigh, NC 27614 and is currently estimated at $333,262, approximately $234 per square foot. 2213 Bankshill Row is a home located in Wake County with nearby schools including Abbotts Creek Elementary School, Wakefield Middle, and Wakefield High School.
Ownership History
Date
Name
Owned For
Owner Type
Purchase Details
Closed on
Aug 19, 2019
Sold by
Matney Rhonda
Bought by
Lockhart Erica Lee and Matney Rhonda
Current Estimated Value
Purchase Details
Closed on
May 21, 2019
Sold by
Bogue Rodd and Bogue Scott Renny
Bought by
Matney Rhoda
Purchase Details
Closed on
May 24, 2011
Sold by
The Srb Family Foundation
Bought by
Bogue Rodd
Purchase Details
Closed on
Oct 10, 2008
Sold by
The Bogue Family Limited Partnership
Bought by
The Srb Family Foundation
Purchase Details
Closed on
Aug 5, 2008
Sold by
D R Horton Inc
Bought by
D R Horton Inc Torrey
Purchase Details
Closed on
Oct 10, 2006
Sold by
Bogue Scott Renny
Bought by
The Bogue Family Lp
Purchase Details
Closed on
Oct 8, 2004
Sold by
D R Horton Inc Torrey
Bought by
Bogue Scott Renny and Bogue Rodd S
Home Financials for this Owner
Home Financials are based on the most recent Mortgage that was taken out on this home.
Original Mortgage
$75,000
Interest Rate
5.71%
Mortgage Type
Stand Alone First
Create a Home Valuation Report for This Property
The Home Valuation Report is an in-depth analysis detailing your home's value as well as a comparison with similar homes in the area
Home Values in the Area
Average Home Value in this Area
Purchase History
| Date | Buyer | Sale Price | Title Company |
|---|---|---|---|
| Lockhart Erica Lee | -- | None Available | |
| Matney Rhoda | $215,000 | None Available | |
| Bogue Rodd | -- | None Available | |
| The Srb Family Foundation | -- | None Available | |
| D R Horton Inc Torrey | -- | None Available | |
| The Bogue Family Lp | -- | None Available | |
| Bogue Scott Renny | $150,000 | -- |
Source: Public Records
Mortgage History
| Date | Status | Borrower | Loan Amount |
|---|---|---|---|
| Previous Owner | Bogue Scott Renny | $75,000 |
Source: Public Records
Tax History Compared to Growth
Tax History
| Year | Tax Paid | Tax Assessment Tax Assessment Total Assessment is a certain percentage of the fair market value that is determined by local assessors to be the total taxable value of land and additions on the property. | Land | Improvement |
|---|---|---|---|---|
| 2025 | $3,078 | $350,667 | $80,000 | $270,667 |
| 2024 | $3,066 | $350,667 | $80,000 | $270,667 |
| 2023 | $2,575 | $234,442 | $47,000 | $187,442 |
| 2022 | $2,394 | $234,442 | $47,000 | $187,442 |
| 2021 | $2,301 | $234,442 | $47,000 | $187,442 |
| 2020 | $2,259 | $234,442 | $47,000 | $187,442 |
| 2019 | $1,879 | $160,453 | $30,000 | $130,453 |
| 2018 | $1,773 | $160,453 | $30,000 | $130,453 |
| 2017 | $1,689 | $160,453 | $30,000 | $130,453 |
| 2016 | $1,655 | $160,453 | $30,000 | $130,453 |
| 2015 | $1,784 | $170,351 | $33,000 | $137,351 |
| 2014 | -- | $170,351 | $33,000 | $137,351 |
Source: Public Records
Map
Nearby Homes
- 2220 Raven Rd Unit 104
- 2106 Cloud Cover
- 2210 Raven Rd Unit 105
- 2210 Raven Rd Unit 106
- 2221 Valley Edge Dr Unit 105
- 2221 Valley Edge Dr Unit 100
- 11309 Shadow Elms Ln
- 2220 Valley Edge Dr Unit 106
- 2220 Valley Edge Dr Unit 103
- 11130 Gwynn Oaks Dr Unit 106
- 2111 Piney Brook Rd Unit 101
- 2408 Gerber Ct
- 2101 Piney Brook Rd Unit 102
- 2110 Piney Brook Rd Unit 104
- 10527 Bedfordtown Dr
- 11006 Connally Ln
- 10638 Cardington Ln
- 10507 Bedfordtown Dr
- 10821 Farmville Rd
- 10859 Bedfordtown Dr
- 2213 Banks Hill Row Rd
- 2211 Bankshill Row
- 2211 Banks Hill Row Rd
- 2221 Banks Hill Row Rd
- 2221 Bankshill Row
- 2209 Bankshill Row
- 2209 Banks Hill Row Rd
- 2223 Banks Hill Row Rd
- 2223 Bankshill Row
- 2207 Banks Hill Row Rd
- 2225 Bankshill Row
- 2225 Banks Hill Row Rd
- 2205 Bankshill Row
- 2227 Banks Hill Row Rd
- 2205 Banks Hill Row Rd
- 2227 Bankshill Row
- 11427 Shadow Elms Ln
- 2229 Banks Hill Row Rd
- 2229 Bankshill Row
- 11423 Shadow Elms Ln