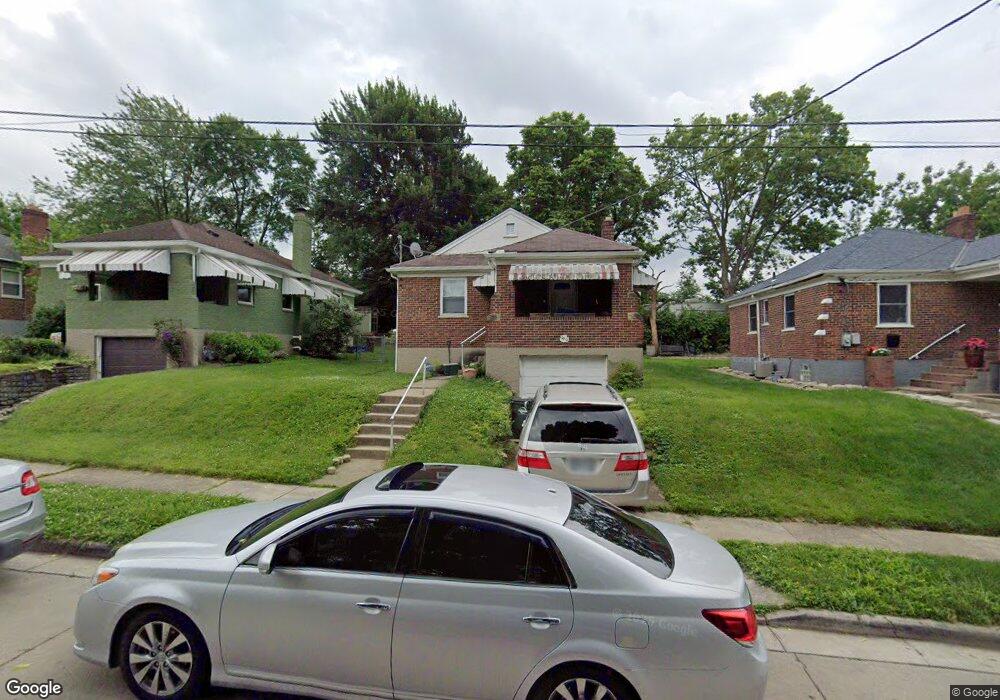
2213 Bremont Ave Cincinnati, OH 45237
Estimated Value: $80,000 - $187,000
2
Beds
1
Bath
841
Sq Ft
$163/Sq Ft
Est. Value
About This Home
This home is located at 2213 Bremont Ave, Cincinnati, OH 45237 and is currently estimated at $137,318, approximately $163 per square foot. 2213 Bremont Ave is a home located in Hamilton County with nearby schools including Pleasant Ridge Montessori School, Shroder High School, and Clark Montessori High School.
Ownership History
Date
Name
Owned For
Owner Type
Purchase Details
Closed on
Mar 6, 2024
Sold by
Sg Investment Team Llc
Bought by
Fat Pie Smith Estates Living Trust and Walker
Current Estimated Value
Purchase Details
Closed on
May 27, 2016
Sold by
Crawford Latoya and Richmond Sheree
Bought by
S G Investment Team Llc
Purchase Details
Closed on
Aug 28, 2002
Sold by
Ronda Larrick and Ronda Terry
Bought by
Smith Tyrone E and Smith Letha A
Home Financials for this Owner
Home Financials are based on the most recent Mortgage that was taken out on this home.
Original Mortgage
$80,510
Interest Rate
6.54%
Purchase Details
Closed on
Jan 17, 1997
Sold by
Larrick Ronda S
Bought by
Larrick Ronda and Larrick Terry
Home Financials for this Owner
Home Financials are based on the most recent Mortgage that was taken out on this home.
Original Mortgage
$48,750
Interest Rate
7.81%
Create a Home Valuation Report for This Property
The Home Valuation Report is an in-depth analysis detailing your home's value as well as a comparison with similar homes in the area
Home Values in the Area
Average Home Value in this Area
Purchase History
| Date | Buyer | Sale Price | Title Company |
|---|---|---|---|
| Fat Pie Smith Estates Living Trust | $80,000 | None Listed On Document | |
| S G Investment Team Llc | $21,000 | -- | |
| Smith Tyrone E | $83,000 | -- | |
| Larrick Ronda | -- | -- |
Source: Public Records
Mortgage History
| Date | Status | Borrower | Loan Amount |
|---|---|---|---|
| Previous Owner | Smith Tyrone E | $80,510 | |
| Previous Owner | Larrick Ronda | $48,750 |
Source: Public Records
Tax History Compared to Growth
Tax History
| Year | Tax Paid | Tax Assessment Tax Assessment Total Assessment is a certain percentage of the fair market value that is determined by local assessors to be the total taxable value of land and additions on the property. | Land | Improvement |
|---|---|---|---|---|
| 2024 | $2,140 | $29,096 | $8,337 | $20,759 |
| 2023 | $2,197 | $29,096 | $8,337 | $20,759 |
| 2022 | $1,115 | $11,865 | $5,383 | $6,482 |
| 2021 | $1,136 | $11,865 | $5,383 | $6,482 |
| 2020 | $1,099 | $11,865 | $5,383 | $6,482 |
| 2019 | $1,107 | $10,501 | $4,764 | $5,737 |
| 2018 | $1,087 | $10,501 | $4,764 | $5,737 |
| 2017 | $1,068 | $10,501 | $4,764 | $5,737 |
| 2016 | $2,282 | $22,022 | $5,292 | $16,730 |
| 2015 | $3,005 | $22,022 | $5,292 | $16,730 |
| 2014 | $2,001 | $22,022 | $5,292 | $16,730 |
| 2013 | $1,925 | $22,022 | $5,292 | $16,730 |
Source: Public Records
Map
Nearby Homes
- 6322 Elbrook Ave
- 6230 Stover Ave
- 2232 Rosedale Ave
- 7072 Eastlawn Dr
- 7100 Eastlawn Dr
- 7110 Eastlawn Dr
- 6243 Graceland Ave
- 6110 Stover Ave
- 6045 Elbrook Ave
- 2425 Bremont Ave
- 2424 Canterbury Ave
- 2365 Vera Ave
- 6025 Mayflower Ave
- 6032 Mayflower Ave
- 6110 Graceland Ave
- 2324 Langdon Farm Rd
- 5994 Wanderling Ln
- 6235 Ridgeacres Dr
- 6770 Elbrook Ave
- 6047 Yosemite Dr
- 2209 Bremont Ave
- 2217 Bremont Ave
- 2205 Bremont Ave
- 2221 Bremont Ave
- 2201 Bremont Ave
- 2200 Bremont Ave
- 6403 Stover Ave
- 2225 Bremont Ave
- 6331 Stover Ave
- 6406 Wiehe Rd
- 6407 Stover Ave
- 6327 Stover Ave
- 6410 Wiehe Rd
- 6411 Stover Ave
- 2237 Bremont Ave
- 6323 Stover Ave
- 6414 Wiehe Rd
- 6415 Stover Ave
- 2241 Bremont Ave
- 6418 Wiehe Rd