Estimated Value: $1,259,985 - $1,329,000
3
Beds
3
Baths
2,466
Sq Ft
$528/Sq Ft
Est. Value
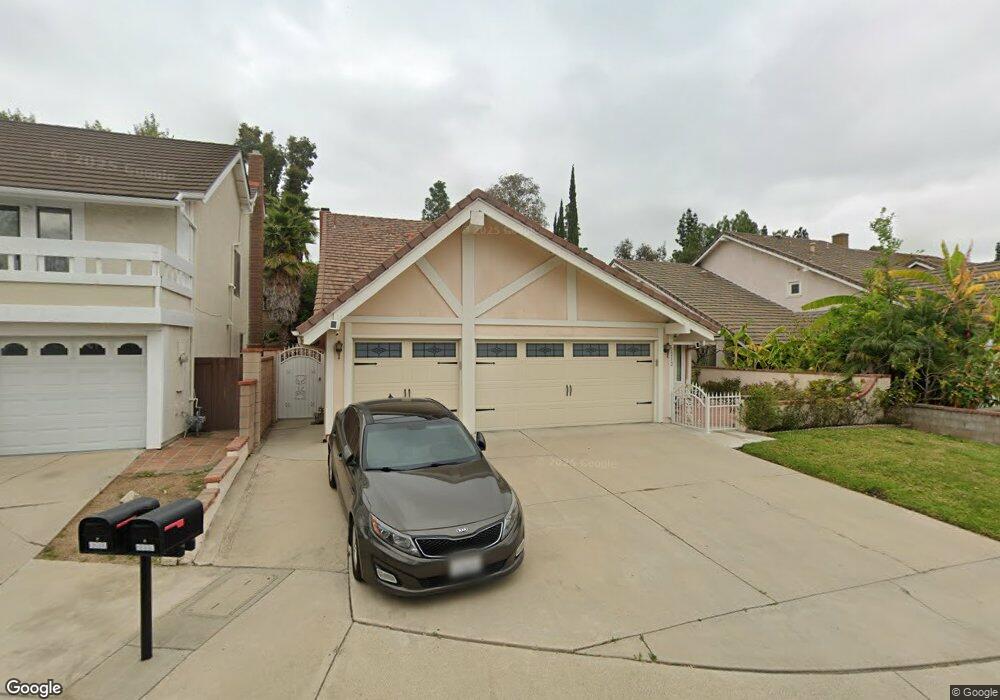
About This Home
This home is located at 2213 Crestview Cir, Brea, CA 92821 and is currently estimated at $1,301,996, approximately $527 per square foot. 2213 Crestview Cir is a home located in Orange County with nearby schools including Brea Country Hills Elementary School, Brea Junior High School, and Brea-Olinda High School.
Ownership History
Date
Name
Owned For
Owner Type
Purchase Details
Closed on
May 29, 2012
Sold by
Shah Anil and Shah Manali
Bought by
Shah Anil and Shah Manali A
Current Estimated Value
Purchase Details
Closed on
Feb 12, 1998
Sold by
Shelton Patrick
Bought by
Shah Anil and Shah Manali
Home Financials for this Owner
Home Financials are based on the most recent Mortgage that was taken out on this home.
Original Mortgage
$208,000
Outstanding Balance
$36,887
Interest Rate
7.02%
Estimated Equity
$1,265,109
Purchase Details
Closed on
Mar 27, 1996
Sold by
Norman Robert M and Norman Mary R
Bought by
Shelton Patrick
Home Financials for this Owner
Home Financials are based on the most recent Mortgage that was taken out on this home.
Original Mortgage
$230,850
Interest Rate
7.68%
Purchase Details
Closed on
Jul 19, 1995
Sold by
Norman Robert Michael and Norman Mary Renee
Bought by
Norman Living Trust
Create a Home Valuation Report for This Property
The Home Valuation Report is an in-depth analysis detailing your home's value as well as a comparison with similar homes in the area
Home Values in the Area
Average Home Value in this Area
Purchase History
| Date | Buyer | Sale Price | Title Company |
|---|---|---|---|
| Shah Anil | -- | None Available | |
| Shah Anil | $260,000 | Benefit Land Title | |
| Shelton Patrick | $243,000 | Orange Coast Title | |
| Norman Living Trust | -- | -- |
Source: Public Records
Mortgage History
| Date | Status | Borrower | Loan Amount |
|---|---|---|---|
| Open | Shah Anil | $208,000 | |
| Previous Owner | Shelton Patrick | $230,850 |
Source: Public Records
Tax History
| Year | Tax Paid | Tax Assessment Tax Assessment Total Assessment is a certain percentage of the fair market value that is determined by local assessors to be the total taxable value of land and additions on the property. | Land | Improvement |
|---|---|---|---|---|
| 2025 | $4,776 | $415,146 | $203,366 | $211,780 |
| 2024 | $4,776 | $407,006 | $199,378 | $207,628 |
| 2023 | $4,642 | $399,026 | $195,469 | $203,557 |
| 2022 | $4,595 | $391,202 | $191,636 | $199,566 |
| 2021 | $4,508 | $383,532 | $187,879 | $195,653 |
| 2020 | $4,477 | $379,600 | $185,953 | $193,647 |
| 2019 | $4,359 | $372,157 | $182,307 | $189,850 |
| 2018 | $4,293 | $364,860 | $178,732 | $186,128 |
| 2017 | $4,211 | $357,706 | $175,227 | $182,479 |
| 2016 | $4,127 | $350,693 | $171,792 | $178,901 |
| 2015 | $4,069 | $345,426 | $169,212 | $176,214 |
| 2014 | $3,951 | $338,660 | $165,897 | $172,763 |
Source: Public Records
Map
Nearby Homes
- 2257 Shadetree Cir
- 2418 Rainbow Ln
- 136 Donnybrook Rd
- 2304 Carrotwood Dr
- 520 N Bardsdale Place
- 2583 Sandpebble Ln
- 570 Olive Ave
- 2761 E Stearns St
- 1975 Heather Cir
- 2440 Sanabria Ln
- 1618 E Eucalyptus St
- 688 Buttonwood Dr
- 341 Adalina Ln
- 198 Sunflower St
- 500 Silver Canyon Way
- 640 Cliffwood Ave
- 897 Kings Canyon Rd
- 360 Meadow Ct
- 3174 E Piru Ln
- 3200 E Santa fe Rd
- 2219 Crestview Cir
- 2207 Crestview Cir
- 2225 Crestview Cir
- 2231 Crestview Cir
- 2220 Crestview Cir
- 2226 Crestview Cir
- 2214 Crestview Cir
- 2232 Crestview Cir
- 2237 Crestview Cir
- 2238 Crestview Cir
- 358 Shadyvale Ln
- 356 Shadyvale Ln
- 2243 Crestview Cir
- 2244 Crestview Cir
- 2217 Shadetree Cir
- 2111 Windbreak Cir
- 2225 Shadetree Cir
- 352 Shadyvale Ln
- 2249 Crestview Cir
- 2233 Shadetree Cir
Your Personal Tour Guide
Ask me questions while you tour the home.