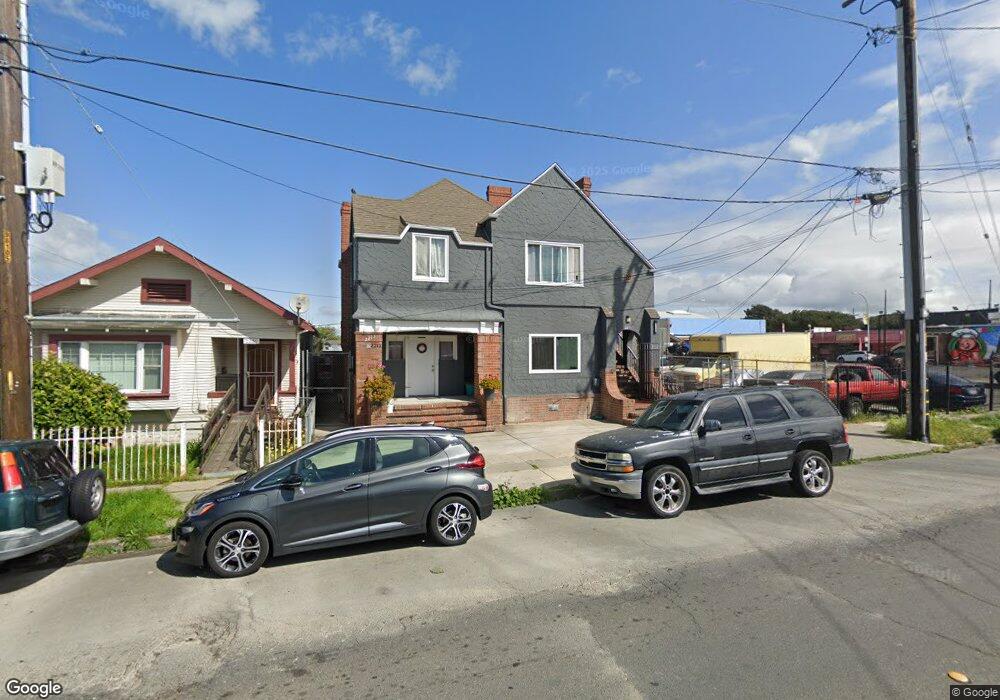
2213 Roosevelt Ave Richmond, CA 94801
Belding Woods NeighborhoodEstimated Value: $449,355 - $747,000
--
Bed
--
Bath
2,822
Sq Ft
$230/Sq Ft
Est. Value
About This Home
This home is located at 2213 Roosevelt Ave, Richmond, CA 94801 and is currently estimated at $648,339, approximately $229 per square foot. 2213 Roosevelt Ave is a home located in Contra Costa County with nearby schools including Grant Elementary School, Lovonya DeJean Middle School, and John F. Kennedy High School.
Ownership History
Date
Name
Owned For
Owner Type
Purchase Details
Closed on
May 31, 2000
Sold by
Francis and Sally
Bought by
Romero Raul and Romero Maria Dejesus
Current Estimated Value
Home Financials for this Owner
Home Financials are based on the most recent Mortgage that was taken out on this home.
Original Mortgage
$105,000
Outstanding Balance
$37,834
Interest Rate
8.53%
Mortgage Type
Purchase Money Mortgage
Estimated Equity
$610,505
Purchase Details
Closed on
Jun 11, 1999
Sold by
Francis and Sally
Bought by
Francis Jonathan and Francis Sally Ann
Create a Home Valuation Report for This Property
The Home Valuation Report is an in-depth analysis detailing your home's value as well as a comparison with similar homes in the area
Home Values in the Area
Average Home Value in this Area
Purchase History
| Date | Buyer | Sale Price | Title Company |
|---|---|---|---|
| Romero Raul | $150,000 | Commonwealth Land Title Co | |
| Francis Jonathan | -- | -- | |
| Francis Jonathan | -- | -- |
Source: Public Records
Mortgage History
| Date | Status | Borrower | Loan Amount |
|---|---|---|---|
| Open | Romero Raul | $105,000 |
Source: Public Records
Tax History Compared to Growth
Tax History
| Year | Tax Paid | Tax Assessment Tax Assessment Total Assessment is a certain percentage of the fair market value that is determined by local assessors to be the total taxable value of land and additions on the property. | Land | Improvement |
|---|---|---|---|---|
| 2025 | $7,983 | $230,524 | $122,947 | $107,577 |
| 2024 | $7,671 | $226,005 | $120,537 | $105,468 |
| 2023 | $7,671 | $221,574 | $118,174 | $103,400 |
| 2022 | $7,400 | $217,230 | $115,857 | $101,373 |
| 2021 | $7,176 | $212,972 | $113,586 | $99,386 |
| 2019 | $6,679 | $206,657 | $110,218 | $96,439 |
| 2018 | $6,403 | $202,606 | $108,057 | $94,549 |
| 2017 | $6,184 | $198,635 | $105,939 | $92,696 |
| 2016 | $6,004 | $194,741 | $103,862 | $90,879 |
| 2015 | $5,864 | $191,816 | $102,302 | $89,514 |
| 2014 | $5,781 | $188,060 | $100,299 | $87,761 |
Source: Public Records
Map
Nearby Homes