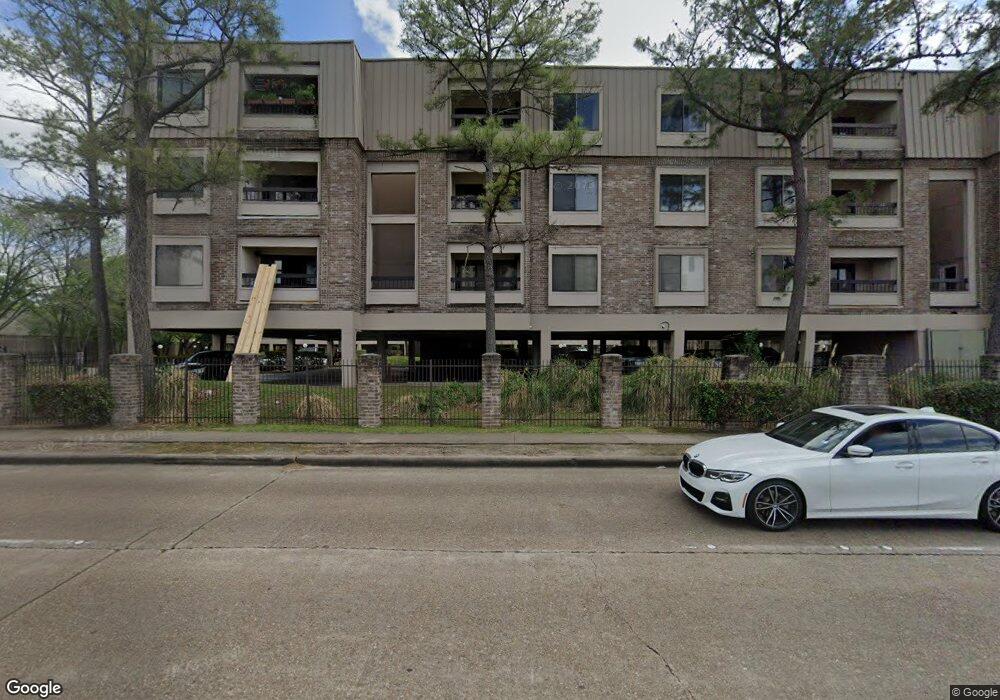
2213 S Braeswood Blvd Unit 1 Houston, TX 77030
Astrodome NeighborhoodEstimated Value: $168,000 - $173,238
3
Beds
2
Baths
1,259
Sq Ft
$135/Sq Ft
Est. Value
About This Home
This home is located at 2213 S Braeswood Blvd Unit 1, Houston, TX 77030 and is currently estimated at $170,060, approximately $135 per square foot. 2213 S Braeswood Blvd Unit 1 is a home located in Harris County with nearby schools including Roberts Elementary School, Cullen Middle School, and Bellaire High School.
Ownership History
Date
Name
Owned For
Owner Type
Purchase Details
Closed on
Jul 15, 2016
Sold by
Geng Yimin and Wang Zhaohui
Bought by
Ahmad Hela
Current Estimated Value
Purchase Details
Closed on
Sep 6, 2011
Sold by
Geng Yimin
Bought by
Wang Zhaohui
Purchase Details
Closed on
Aug 30, 2011
Sold by
Wang Xinwen and Yang Yu
Bought by
Geng Yimin
Purchase Details
Closed on
Dec 13, 2001
Sold by
Lu Meisheng and Zhong Mei Ling
Bought by
Yan Wei
Home Financials for this Owner
Home Financials are based on the most recent Mortgage that was taken out on this home.
Original Mortgage
$61,600
Interest Rate
6.52%
Purchase Details
Closed on
Apr 9, 1997
Sold by
Landeros Raul and Landeros Blanca Esther
Bought by
Lu Meisheng
Create a Home Valuation Report for This Property
The Home Valuation Report is an in-depth analysis detailing your home's value as well as a comparison with similar homes in the area
Home Values in the Area
Average Home Value in this Area
Purchase History
| Date | Buyer | Sale Price | Title Company |
|---|---|---|---|
| Ahmad Hela | -- | None Available | |
| Wang Zhaohui | -- | None Available | |
| Geng Yimin | -- | None Available | |
| Yan Wei | -- | -- | |
| Lu Meisheng | -- | Regency Title | |
| Lu Meishing | -- | Regency Title |
Source: Public Records
Mortgage History
| Date | Status | Borrower | Loan Amount |
|---|---|---|---|
| Previous Owner | Yan Wei | $61,600 |
Source: Public Records
Tax History Compared to Growth
Tax History
| Year | Tax Paid | Tax Assessment Tax Assessment Total Assessment is a certain percentage of the fair market value that is determined by local assessors to be the total taxable value of land and additions on the property. | Land | Improvement |
|---|---|---|---|---|
| 2025 | $1,833 | $142,480 | $27,071 | $115,409 |
| 2024 | $1,833 | $161,089 | $30,607 | $130,482 |
| 2023 | $1,833 | $166,940 | $31,719 | $135,221 |
| 2022 | $3,252 | $147,686 | $30,888 | $116,798 |
| 2021 | $3,872 | $166,113 | $32,807 | $133,306 |
| 2020 | $4,023 | $166,113 | $32,807 | $133,306 |
| 2019 | $4,369 | $172,668 | $32,807 | $139,861 |
| 2018 | $4,261 | $168,375 | $31,991 | $136,384 |
| 2017 | $4,257 | $168,375 | $31,991 | $136,384 |
| 2016 | $3,395 | $161,441 | $31,651 | $129,790 |
| 2015 | $2,115 | $161,441 | $31,651 | $129,790 |
| 2014 | $2,115 | $129,043 | $24,518 | $104,525 |
Source: Public Records
Map
Nearby Homes
- 2213 S Braeswood Blvd Unit 12H
- 2213 S Braeswood Blvd Unit 12B
- 2207 S Braeswood Blvd Unit 43-b
- 2207 S Braeswood Blvd Unit 42E
- 2211 S Braeswood Blvd Unit 22H
- 7900 N Stadium Dr Unit 47
- 7900 N Stadium Dr Unit 48
- 7900 N Stadium Dr Unit 123
- 7900 N Stadium Dr Unit 102
- 7900 N Stadium Dr Unit 53
- 7900 N Stadium Dr Unit 97
- 7950 N Stadium Dr Unit 138
- 7950 N Stadium Dr Unit 210
- 7950 N Stadium Dr Unit 232
- 7950 N Stadium Dr Unit 157
- 7950 N Stadium Dr Unit 136
- 2255 Braeswood Park Dr Unit 219
- 2255 Braeswood Park Dr Unit 105
- 2255 Braeswood Park Dr Unit 225
- 2255 Braeswood Park Dr Unit 166
- 2213 S Braeswood Blvd Unit 1
- 2213 S Braeswood Blvd Unit 1
- 2213 S Braeswood Blvd Unit 1
- 2213 S Braeswood Blvd Unit 1
- 2213 S Braeswood Blvd Unit 1
- 2213 S Braeswood Blvd Unit 1
- 2213 S Braeswood Blvd
- 2213 S Braeswood Blvd
- 2213 S Braeswood Blvd
- 2213 S Braeswood Blvd
- 2213 S Braeswood Blvd Unit 1
- 2213 S Braeswood Blvd Unit 1
- 2213 S Braeswood Blvd
- 2213 S Braeswood Blvd Unit 1
- 2213 S Braeswood Blvd Unit 1
- 2213 S Braeswood Blvd Unit 1
- 2213 S Braeswood Blvd Unit 1
- 2213 S Braeswood Blvd Unit 1
- 2213 S Braeswood Blvd Unit 1
- 2213 S Braeswood Blvd Unit 1