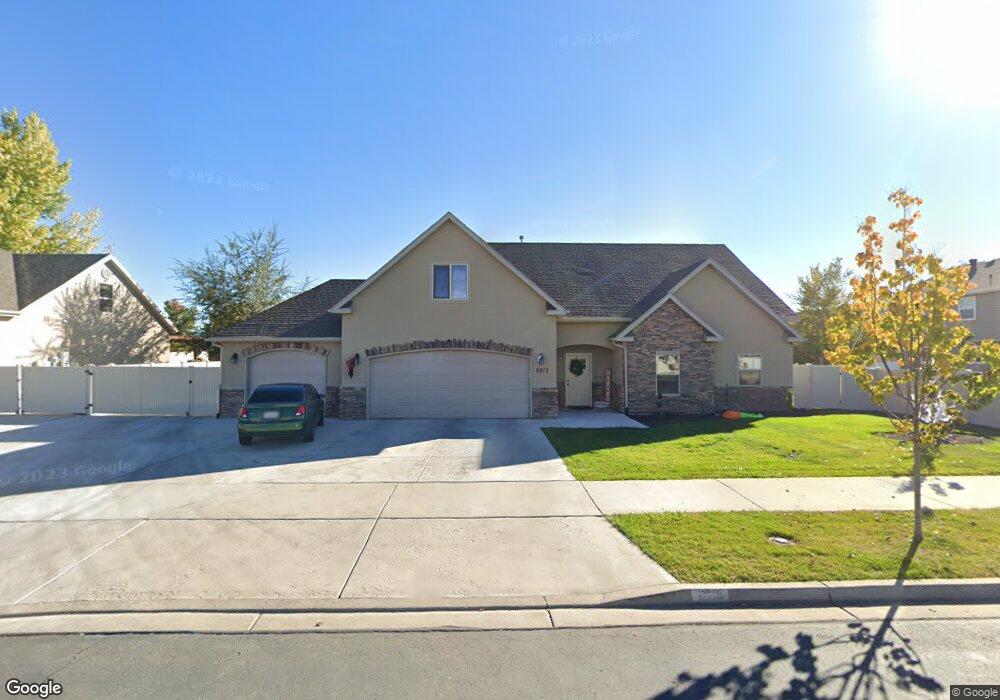
2213 W 470 S Provo, UT 84601
Franklin NeighborhoodEstimated Value: $680,410 - $714,000
5
Beds
3
Baths
2,837
Sq Ft
$245/Sq Ft
Est. Value
About This Home
This home is located at 2213 W 470 S, Provo, UT 84601 and is currently estimated at $695,137, approximately $245 per square foot. 2213 W 470 S is a home located in Utah County with nearby schools including Dixon Middle School, Provo High School, and Freedom Preparatory Academy.
Ownership History
Date
Name
Owned For
Owner Type
Purchase Details
Closed on
Aug 16, 2018
Sold by
Allen Von D
Bought by
Valadez Francisco Javier and Lopez Yaret
Current Estimated Value
Home Financials for this Owner
Home Financials are based on the most recent Mortgage that was taken out on this home.
Original Mortgage
$363,750
Outstanding Balance
$315,902
Interest Rate
4.5%
Mortgage Type
New Conventional
Estimated Equity
$379,235
Purchase Details
Closed on
May 4, 2007
Sold by
Measom Spencer T
Bought by
Allen Von D
Home Financials for this Owner
Home Financials are based on the most recent Mortgage that was taken out on this home.
Original Mortgage
$300,000
Interest Rate
6.17%
Mortgage Type
Purchase Money Mortgage
Purchase Details
Closed on
Sep 27, 2006
Sold by
Park Place Construction Llc
Bought by
Measom Spencer T
Purchase Details
Closed on
Jul 5, 2006
Sold by
Schauers Justin and Measom Spencer T
Bought by
Park Place Construction Llc
Create a Home Valuation Report for This Property
The Home Valuation Report is an in-depth analysis detailing your home's value as well as a comparison with similar homes in the area
Home Values in the Area
Average Home Value in this Area
Purchase History
| Date | Buyer | Sale Price | Title Company |
|---|---|---|---|
| Valadez Francisco Javier | -- | Paramount Title | |
| Allen Von D | -- | Surety Title | |
| Measom Spencer T | -- | Equity Title Orem Blvd | |
| Park Place Construction Llc | -- | Equity Title Orem Blvd |
Source: Public Records
Mortgage History
| Date | Status | Borrower | Loan Amount |
|---|---|---|---|
| Open | Valadez Francisco Javier | $363,750 | |
| Previous Owner | Allen Von D | $300,000 |
Source: Public Records
Tax History
| Year | Tax Paid | Tax Assessment Tax Assessment Total Assessment is a certain percentage of the fair market value that is determined by local assessors to be the total taxable value of land and additions on the property. | Land | Improvement |
|---|---|---|---|---|
| 2025 | $3,109 | $339,460 | -- | -- |
| 2024 | $3,109 | $306,075 | $0 | $0 |
| 2023 | $3,039 | $294,910 | $0 | $0 |
| 2022 | $3,118 | $305,085 | $0 | $0 |
| 2021 | $2,506 | $427,600 | $129,000 | $298,600 |
| 2020 | $2,413 | $386,100 | $112,200 | $273,900 |
| 2019 | $2,309 | $384,200 | $112,200 | $272,000 |
| 2018 | $2,002 | $337,800 | $101,300 | $236,500 |
| 2017 | $1,894 | $175,615 | $0 | $0 |
| 2016 | $1,940 | $167,640 | $0 | $0 |
| 2015 | $1,851 | $161,700 | $0 | $0 |
| 2014 | $1,753 | $159,665 | $0 | $0 |
Source: Public Records
Map
Nearby Homes
- 312 S 1920 W
- 2424 W 230 S
- 2471 W 180 S
- 1774 W 520 S
- 213 N Geneva Rd
- 249 West Ln Unit 10
- 1631 W 50 N
- 1075 Lakeview Pkwy
- 1125 Lakeview Pkwy
- 1505 W 100 S
- 89 S 1530 W
- 255 N 1600 W Unit 148
- 255 N 1600 W Unit 52
- 255 N 1600 W Unit 108
- 255 N 1600 W Unit 94
- 255 N 1600 W Unit 73
- 1309 Westbridge Cir
- 2855 W 230 N
- 1303 W 600 S
- 483 N 2430 W
- 2213 W 470 S Unit 38
- 2199 W 470 S
- 485 S 2280 W
- 499 S 2280 W
- 452 S 2210 W
- 452 S 2210 W Unit 37
- 453 S 2280 W
- 2171 W 470 S
- 2171 W 470 S Unit 40
- 2188 W 470 S
- 2188 W 470 S Unit 11
- 2188 S 470
- 438 S 2210 W
- 474 S 2280 W Unit 25
- 474 S 2280 W
- 441 S 2280 W
- 496 S 2280 W Unit 26
- 496 S 2280 W
- 462 S 2280 W
- 535 S 2280 W Unit 33
Your Personal Tour Guide
Ask me questions while you tour the home.