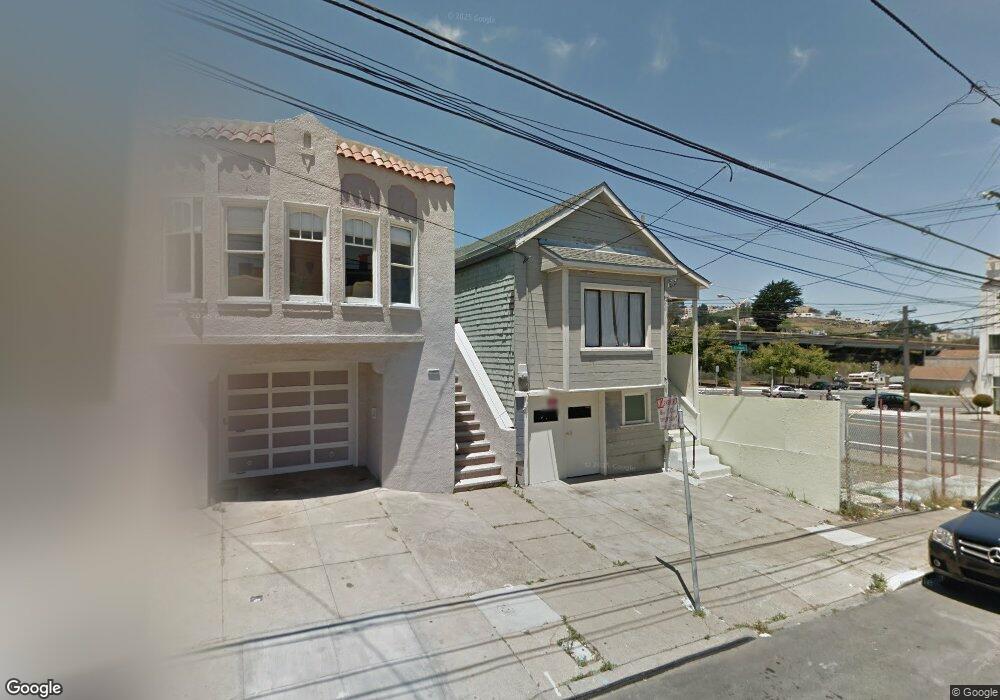
2214 Cayuga Ave San Francisco, CA 94112
Outer Mission NeighborhoodEstimated Value: $806,000 - $897,000
--
Bed
1
Bath
800
Sq Ft
$1,067/Sq Ft
Est. Value
About This Home
This home is located at 2214 Cayuga Ave, San Francisco, CA 94112 and is currently estimated at $853,375, approximately $1,066 per square foot. 2214 Cayuga Ave is a home located in San Francisco County with nearby schools including Longfellow Elementary School, Denman (James) Middle School, and San Francisco Christian School.
Ownership History
Date
Name
Owned For
Owner Type
Purchase Details
Closed on
Dec 17, 2016
Sold by
Tam Yin Kwan
Bought by
Tam Yin Kwan and The Yin Kwan Tam Family Trust
Current Estimated Value
Purchase Details
Closed on
Jan 6, 2015
Sold by
Tong Di Fun Tsang
Bought by
Tong Yin Kai
Purchase Details
Closed on
Oct 17, 2002
Sold by
Giosso Daniel W and Giosso James
Bought by
The Dante & Mary Giosso Family Ltd Partn
Purchase Details
Closed on
Mar 24, 2001
Sold by
Giosso Mary
Bought by
Giosso Daniel W and Giosso James
Purchase Details
Closed on
Apr 18, 1998
Sold by
Giosso Guido V and Giosso Guido
Bought by
The Guido & Pierina Giosso Family Ltd Pa
Purchase Details
Closed on
Oct 11, 1997
Sold by
Dante Giosso and Mary Giosso
Bought by
Giosso Dante and Giosso Mary
Create a Home Valuation Report for This Property
The Home Valuation Report is an in-depth analysis detailing your home's value as well as a comparison with similar homes in the area
Home Values in the Area
Average Home Value in this Area
Purchase History
| Date | Buyer | Sale Price | Title Company |
|---|---|---|---|
| Tam Yin Kwan | -- | None Available | |
| Tong Yin Kai | -- | Cornerstone Title Company | |
| Tam Yin Kwan | -- | Cornerstone Title Company | |
| Tam Yin Kwan | $900,000 | Cornerstone Title Company | |
| The Dante & Mary Giosso Family Ltd Partn | -- | -- | |
| The Dante & Mary Giosso Family Ltd Partn | -- | -- | |
| Giosso Daniel W | -- | -- | |
| Giosso Daniel W | -- | -- | |
| The Guido & Pierina Giosso Family Ltd Pa | -- | -- | |
| Giosso Dante | -- | -- | |
| Giosso Dante | -- | -- |
Source: Public Records
Tax History Compared to Growth
Tax History
| Year | Tax Paid | Tax Assessment Tax Assessment Total Assessment is a certain percentage of the fair market value that is determined by local assessors to be the total taxable value of land and additions on the property. | Land | Improvement |
|---|---|---|---|---|
| 2025 | $10,132 | $781,311 | $546,836 | $234,356 |
| 2024 | $10,132 | $766,027 | $536,114 | $229,761 |
| 2023 | $9,671 | $751,040 | $525,602 | $225,256 |
| 2022 | $9,471 | $736,330 | $515,297 | $220,840 |
| 2021 | $9,303 | $721,974 | $505,192 | $216,782 |
| 2020 | $9,404 | $714,378 | $500,012 | $214,366 |
| 2019 | $9,088 | $700,374 | $490,208 | $210,166 |
| 2018 | $8,781 | $686,646 | $480,598 | $206,048 |
| 2017 | $8,381 | $673,186 | $471,176 | $202,010 |
| 2016 | $8,227 | $659,990 | $461,938 | $198,052 |
| 2015 | $4,737 | $363,836 | $274,656 | $89,180 |
| 2014 | $4,615 | $356,713 | $269,277 | $87,436 |
Source: Public Records
Map
Nearby Homes
- 900 Huron Ave
- 3223 San Jose Ave
- 2921 Alemany Blvd
- 106 Broad St
- 713 Acton St
- 3268 San Jose Ave
- 42 Farragut Ave
- 961 Hanover St
- 5698 Mission St
- 502 Plymouth Ave
- 230 Rhine St
- 63 Minerva St
- 171 Margaret Ave
- 5000 Summit St
- 395 Frankfort St
- 788 Templeton Ave
- 108 Naglee Ave
- 895 Bellevue Ave
- 891 Bellevue Ave
- 100 Chelsea Ct Unit B
- 2220 Cayuga Ave
- 2226 Cayuga Ave
- 2232 Cayuga Ave
- 2203 Cayuga Ave Unit 2205
- 3119 Alemany Blvd
- 2209 Cayuga Ave Unit 2211
- 2236 Cayuga Ave
- 3125 Alemany Blvd
- 189 Sickles Ave Unit 191
- 2240 Cayuga Ave
- 2198 Alemany Blvd
- 2188 Alemany Blvd
- 3129 Alemany Blvd
- 2219 Cayuga Ave
- 2223 Cayuga Ave
- 3135 Alemany Blvd
- 2246 Cayuga Ave
- 177 Sickles Ave Unit 179
- 2229 Cayuga Ave
- 188 Sickles Ave