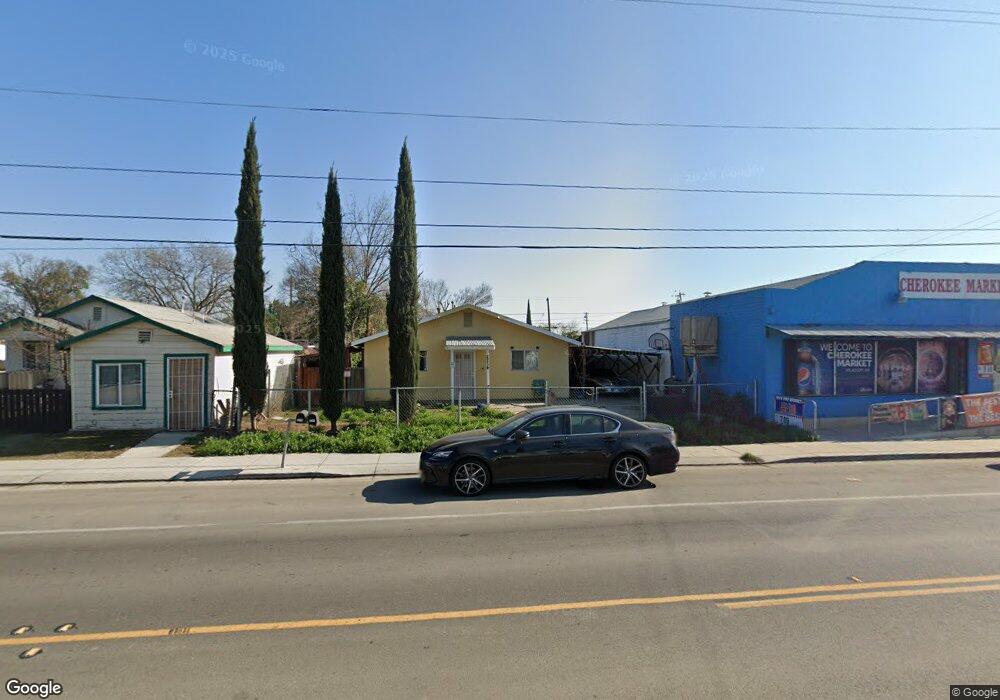
2214 Cherokee Rd Stockton, CA 95205
Estimated Value: $265,000 - $370,000
3
Beds
1
Bath
980
Sq Ft
$317/Sq Ft
Est. Value
About This Home
This home is located at 2214 Cherokee Rd, Stockton, CA 95205 and is currently estimated at $310,401, approximately $316 per square foot. 2214 Cherokee Rd is a home located in San Joaquin County with nearby schools including August Elementary School, Harrison Elementary School, and Grunsky Elementary School.
Ownership History
Date
Name
Owned For
Owner Type
Purchase Details
Closed on
Sep 7, 2011
Sold by
Nguyen Hoa
Bought by
Nguyen Jim
Current Estimated Value
Purchase Details
Closed on
Sep 2, 2011
Sold by
Us Bank National Association
Bought by
Nguyen Jim
Purchase Details
Closed on
Jun 20, 2011
Sold by
Miranda Felipe
Bought by
U S Bank National Association
Purchase Details
Closed on
Apr 28, 2006
Sold by
Miranda Martin
Bought by
Miranda Felipe
Home Financials for this Owner
Home Financials are based on the most recent Mortgage that was taken out on this home.
Original Mortgage
$178,000
Interest Rate
7.3%
Mortgage Type
Balloon
Purchase Details
Closed on
Oct 6, 1997
Sold by
Keener David D
Bought by
Miranda Felipe and Miranda Martin
Purchase Details
Closed on
Jun 22, 1995
Sold by
Soderlund Kerry and Enderlin Dennis
Bought by
Keener David D
Create a Home Valuation Report for This Property
The Home Valuation Report is an in-depth analysis detailing your home's value as well as a comparison with similar homes in the area
Home Values in the Area
Average Home Value in this Area
Purchase History
| Date | Buyer | Sale Price | Title Company |
|---|---|---|---|
| Nguyen Jim | -- | First American Title Company | |
| Nguyen Jim | $45,500 | First American Title Company | |
| U S Bank National Association | $46,638 | Servicelink | |
| Miranda Felipe | -- | Alliance Title Company | |
| Miranda Felipe | $65,000 | Central Valley Title Company | |
| Keener David D | $10,000 | Central Valley Title Company |
Source: Public Records
Mortgage History
| Date | Status | Borrower | Loan Amount |
|---|---|---|---|
| Previous Owner | Miranda Felipe | $178,000 |
Source: Public Records
Tax History Compared to Growth
Tax History
| Year | Tax Paid | Tax Assessment Tax Assessment Total Assessment is a certain percentage of the fair market value that is determined by local assessors to be the total taxable value of land and additions on the property. | Land | Improvement |
|---|---|---|---|---|
| 2025 | $804 | $57,140 | $11,299 | $45,841 |
| 2024 | $792 | $56,021 | $11,078 | $44,943 |
| 2023 | $775 | $54,923 | $10,861 | $44,062 |
| 2022 | $738 | $53,848 | $10,649 | $43,199 |
| 2021 | $711 | $52,793 | $10,441 | $42,352 |
| 2020 | $862 | $52,252 | $10,334 | $41,918 |
| 2019 | $652 | $51,229 | $10,132 | $41,097 |
| 2018 | $639 | $50,226 | $9,934 | $40,292 |
| 2017 | $853 | $49,242 | $9,740 | $39,502 |
| 2016 | $1,053 | $48,277 | $9,549 | $38,728 |
| 2014 | $1,132 | $46,621 | $9,222 | $37,399 |
Source: Public Records
Map
Nearby Homes
- 2819 Belle Ave
- 2525 Vail Ave
- 1825 N Filbert St
- 1550 N Filbert St
- 1551 Chronicle Ave
- 2340 Sanguinetti Ln Unit 54
- 2484 Francis St
- 1413 N Newport Ave
- 2612 E Harding Way
- 1368 N Newport Ave
- 2347 E Alpine Ave
- 2337 E Alpine Ave
- 2312 E Stadium Dr
- 1404 Williams St
- 2224 Big Oak Ct
- 1702 Sunnyside Ave
- 1751 Sunnyside Ave
- 1600 Sunnyside Ave
- 1751 Sycamore Ave
- 1620 Sycamore Ave
- 2218 Cherokee Rd
- 2228 Cherokee Rd
- 2236 Sunset Ave
- 2188 Cherokee Rd
- 2236 Cherokee Rd
- 2203 Cherokee Rd
- 2228 Sunset Ave
- 2244 Cherokee Rd
- 2233 Cherokee Rd
- 2228 Mccomb Ave
- 2231 Sunset Ave
- 2250 Cherokee Rd
- 2212 Sunset Ave
- 2310 Mccomb Ave
- 2171 Cherokee Rd
- 2164 Cherokee Rd
- 2164 Cherokee Rd
- 2227 Totten Ave
- 2219 Sunset Ave
- 2217 Mccomb Ave