
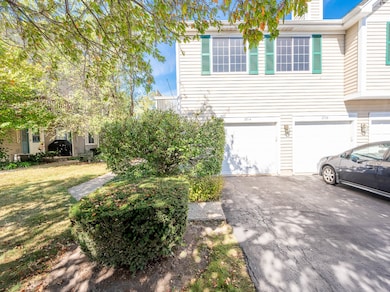
2214 Colorado Ave Unit 4 Elgin, IL 60123
Far West Elgin NeighborhoodEstimated payment $1,669/month
Highlights
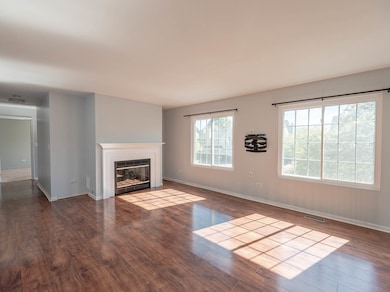
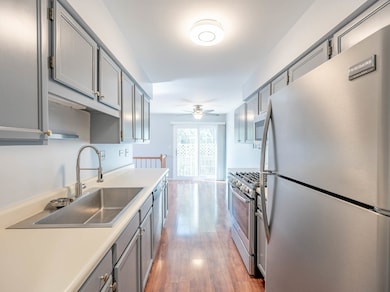
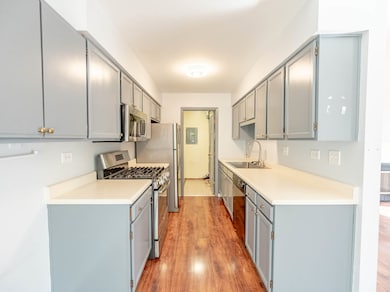
- Wood Flooring
- Living Room
- Central Air
- Breakfast Bar
- Laundry Room
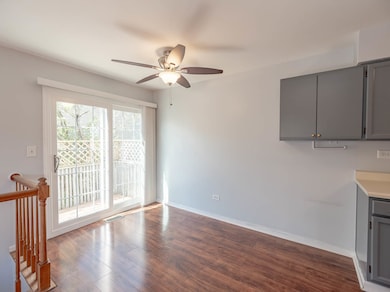
- Dining Room
About This Home
Great opportunity in Elgin! This property offers a convenient location near shopping, dining, schools, and major roadways. Spacious lot with plenty of potential. Bring your ideas and make this home your own!
Property Details
Home Type
- Condominium
Est. Annual Taxes
- $3,551
Year Built
- Built in 1988
HOA Fees
- $133 Monthly HOA Fees
Parking
- 1 Car Garage
Home Design
- Entry on the 1st floor
Interior Spaces
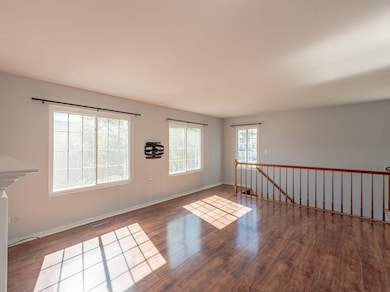
- 2-Story Property
- Family Room
- Living Room
- Dining Room
- Laundry Room
Kitchen
- Breakfast Bar
- Range
- Microwave
- Dishwasher
Flooring
- Wood
- Carpet
Bedrooms and Bathrooms
- 2 Bedrooms
- 2 Potential Bedrooms
- 1 Full Bathroom
Utilities
- Central Air
- Heating System Uses Natural Gas
Listing and Financial Details
- Homeowner Tax Exemptions
Community Details
Overview
- Association fees include exterior maintenance, lawn care, snow removal
- 4 Units
- Bonnie Stanchiu Association, Phone Number (847) 682-1111
- Property managed by CARRIAGE HOMES OF WESTWOOD -ASSOCIATION
Pet Policy
- No Pets Allowed
Map
Home Values in the Area
Average Home Value in this Area
Tax History
| Year | Tax Paid | Tax Assessment Tax Assessment Total Assessment is a certain percentage of the fair market value that is determined by local assessors to be the total taxable value of land and additions on the property. | Land | Improvement |
|---|---|---|---|---|
| 2024 | $3,551 | $52,376 | $15,921 | $36,455 |
| 2023 | $3,352 | $47,317 | $14,383 | $32,934 |
| 2022 | $3,221 | $43,145 | $13,115 | $30,030 |
| 2021 | $3,064 | $40,338 | $12,262 | $28,076 |
| 2020 | $2,965 | $38,509 | $11,706 | $26,803 |
| 2019 | $2,866 | $36,683 | $11,151 | $25,532 |
| 2018 | $2,823 | $34,558 | $10,505 | $24,053 |
| 2017 | $2,743 | $32,670 | $9,931 | $22,739 |
| 2016 | $2,593 | $30,309 | $9,213 | $21,096 |
| 2015 | -- | $27,781 | $8,445 | $19,336 |
| 2014 | -- | $25,702 | $8,341 | $17,361 |
| 2013 | -- | $26,380 | $8,561 | $17,819 |
Property History
| Date | Event | Price | List to Sale | Price per Sq Ft |
|---|---|---|---|---|
| 11/05/2025 11/05/25 | For Sale | $234,900 | -- | -- |
Purchase History
| Date | Type | Sale Price | Title Company |
|---|---|---|---|
| Warranty Deed | $195,000 | None Listed On Document | |
| Quit Claim Deed | -- | None Listed On Document | |
| Interfamily Deed Transfer | -- | Closing Usa Llc | |
| Deed | $75,000 | Chicago Title Insurance Co | |
| Interfamily Deed Transfer | -- | -- |
Mortgage History
| Date | Status | Loan Amount | Loan Type |
|---|---|---|---|
| Previous Owner | $98,000 | New Conventional | |
| Previous Owner | $98,000 | New Conventional | |
| Previous Owner | $73,098 | FHA |
Source: Midwest Real Estate Data (MRED)
MLS Number: 12512172
APN: 06-09-383-022
Disclaimer: Certain information contained herein is derived from information provided by parties other than Homes.com. All information provided is deemed reliable, but is not guaranteed to be accurate and should be independently verified.
![]() Based on information submitted to the MLS GRID. All data is obtained from various sources and may not have been verified by broker or MLS GRID. Supplied Open House Information is subject to change without notice. All information should be independently reviewed and verified for accuracy. Properties may or may not be listed by the office/agent presenting the information. Some IDX listings have been excluded from this website.
Based on information submitted to the MLS GRID. All data is obtained from various sources and may not have been verified by broker or MLS GRID. Supplied Open House Information is subject to change without notice. All information should be independently reviewed and verified for accuracy. Properties may or may not be listed by the office/agent presenting the information. Some IDX listings have been excluded from this website.
The Digital Millennium Copyright Act of 1998, 17 U.S.C. § 512 (the “DMCA”) provides recourse for copyright owners who believe that material appearing on the Internet infringes their rights under U.S. copyright law. If you believe in good faith that any content or material made available in connection with our website or services infringes your copyright, you (or your agent) may send us a notice requesting that the content or material be removed, or access to it blocked.
Notices must be sent in writing by email to DMCAnotice@MLSGrid.com.
The DMCA requires that your notice of alleged copyright infringement include the following information:
(1) description of the copyrighted work that is the subject of claimed infringement;
(2) description of the alleged infringing content and information sufficient to permit us to locate the content;
(3) contact information for you, including your address, telephone number and email address;
(4) a statement by you that you have a good faith belief that the content in the manner complained of is not authorized by the copyright owner, or its agent, or by the operation of any law;
(5) a statement by you, signed under penalty of perjury, that the information in the notification is accurate and that you have the authority to enforce the copyrights that are claimed to be infringed; and
(6) a physical or electronic signature of the copyright owner or a person authorized to act on the copyright owner’s behalf. Failure to include all of the above information may result in the delay of the processing of your complaint.
- 2141 Colorado Ave Unit 3
- 2133 Colorado Ave Unit 1
- Lot 1 Highland Springs Dr
- 640 Highland Springs Dr
- 519 Shagbark Dr
- 609 N Lyle Ave
- Geneva Plan at The Villas at Madison Lane
- 949 Millcreek Cir
- 12N309 Hilltop Rd
- 514 Madison Ln
- 515 Madison Ln
- 2461 Tall Oaks Dr
- 2032 Swan Ln
- 2022 Torino Dr
- 520 N Lyle Ave
- 500 N Lyle Ave
- 900 Ruth Dr
- 2795 Brechin Trail
- 2013 Jeffrey Ln Unit 2013
- 92 N Airlite St
- 500 Redtail Ridge
- 2120 Belvidere Line Dr
- 485 N Airlite St
- 1450 Getzelman Dr Unit 2E
- 420 Heine Ave Unit 420
- 85 N Lyle Ave Unit 5
- 1450 Plymouth Ln Unit 214
- 1300 Getzelman Dr Unit 4
- 1068 Todd Farm Dr
- 51 Surrey Dr
- 6 Tivoli Place
- 3388 Sanctuary Dr Unit 52
- 65 N Aldine St Unit 2
- 237 Robert Dr
- 520 Lawrence Ave Unit Furnished Unit
- 300 N State St
- 3831 Currant Ln
- 200 Goldenrod Dr
- 208 Goldenrod Dr Unit 1
- 192 Goldenrod Dr
