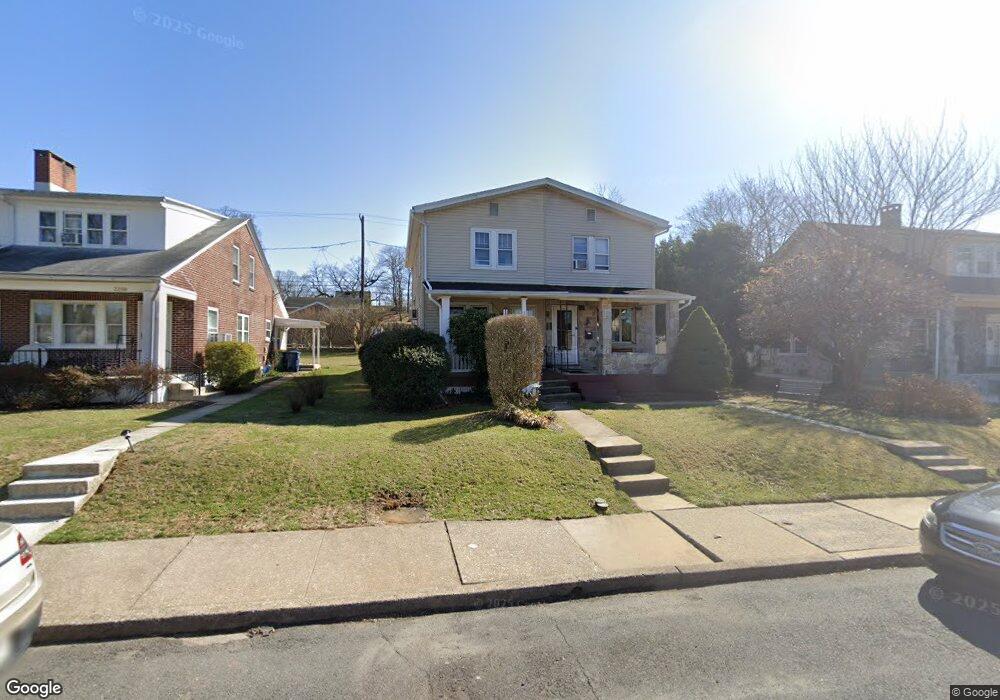
2214 Garfield Ave Reading, PA 19609
West Wyomissing NeighborhoodEstimated Value: $226,777 - $251,000
3
Beds
1
Bath
1,316
Sq Ft
$183/Sq Ft
Est. Value
About This Home
This home is located at 2214 Garfield Ave, Reading, PA 19609 and is currently estimated at $241,444, approximately $183 per square foot. 2214 Garfield Ave is a home located in Berks County with nearby schools including Spring Ridge Elementary School, Wilson Southern Middle School, and Wilson High School.
Ownership History
Date
Name
Owned For
Owner Type
Purchase Details
Closed on
Jun 26, 2009
Sold by
Morales Miguel A
Bought by
Santiago Denise
Current Estimated Value
Home Financials for this Owner
Home Financials are based on the most recent Mortgage that was taken out on this home.
Original Mortgage
$122,735
Interest Rate
5.21%
Mortgage Type
FHA
Purchase Details
Closed on
Aug 29, 2007
Sold by
Jp Morgan Chase Bank
Bought by
Morales Miguel A
Purchase Details
Closed on
Aug 14, 2007
Sold by
Lepera Clint A and Koller Kathleen M
Bought by
Jp Morgan Chase Bank
Purchase Details
Closed on
Mar 18, 2005
Sold by
Koller Donna L
Bought by
Koller Kathleen M and Lepera Clint A
Home Financials for this Owner
Home Financials are based on the most recent Mortgage that was taken out on this home.
Original Mortgage
$80,665
Interest Rate
5.94%
Mortgage Type
Fannie Mae Freddie Mac
Create a Home Valuation Report for This Property
The Home Valuation Report is an in-depth analysis detailing your home's value as well as a comparison with similar homes in the area
Home Values in the Area
Average Home Value in this Area
Purchase History
| Date | Buyer | Sale Price | Title Company |
|---|---|---|---|
| Santiago Denise | $125,000 | None Available | |
| Morales Miguel A | $101,000 | None Available | |
| Jp Morgan Chase Bank | $2,200 | None Available | |
| Koller Kathleen M | $94,900 | First American Title Ins Co |
Source: Public Records
Mortgage History
| Date | Status | Borrower | Loan Amount |
|---|---|---|---|
| Previous Owner | Santiago Denise | $122,735 | |
| Previous Owner | Koller Kathleen M | $80,665 |
Source: Public Records
Tax History Compared to Growth
Tax History
| Year | Tax Paid | Tax Assessment Tax Assessment Total Assessment is a certain percentage of the fair market value that is determined by local assessors to be the total taxable value of land and additions on the property. | Land | Improvement |
|---|---|---|---|---|
| 2025 | $1,398 | $67,100 | $22,100 | $45,000 |
| 2024 | $2,871 | $67,100 | $22,100 | $45,000 |
| 2023 | $2,735 | $67,100 | $22,100 | $45,000 |
| 2022 | $2,668 | $67,100 | $22,100 | $45,000 |
| 2021 | $2,574 | $67,100 | $22,100 | $45,000 |
| 2020 | $2,574 | $67,100 | $22,100 | $45,000 |
| 2019 | $2,501 | $67,100 | $22,100 | $45,000 |
| 2018 | $2,480 | $67,100 | $22,100 | $45,000 |
| 2017 | $2,438 | $67,100 | $22,100 | $45,000 |
| 2016 | $964 | $67,100 | $22,100 | $45,000 |
| 2015 | $964 | $67,100 | $22,100 | $45,000 |
| 2014 | $964 | $67,100 | $22,100 | $45,000 |
Source: Public Records
Map
Nearby Homes
- 2152 Cleveland Ave
- 2126 Lincoln Ave
- 609 Lawn
- 2214 Mckinley Ave
- 608 W Wyomissing Blvd
- 719 W Wyomissing Blvd
- 1812 Portland Ave
- 2021 Noble St
- 2408 Noble St
- 211 Halsey Ave
- 1 Wyomissing Hills Blvd
- 2552 Garfield Ave
- 1809 Squire Ct
- 1801 Reading Blvd
- 321 Jefferson Blvd
- 1334 W Wyomissing Ct Unit Q
- 61 Grandview Blvd
- 101 Robert Rd
- 125 Grandview Blvd
- 121 Grandview Blvd
- 2212 Garfield Ave
- 2220 Garfield Ave
- 2208 Garfield Ave
- 2222 Garfield Ave
- 2206 Garfield Ave
- 2224 Garfield Ave
- 2230 Garfield Ave
- 2213 Reading Blvd
- 2201 Reading Blvd
- 2215 Garfield Ave
- 2203 Garfield Ave
- 2229 Reading Blvd
- 2201 Garfield Ave
- 2180 Garfield Ave
- 2219 Garfield Ave
- 2232 Garfield Ave
- 2233 Reading Blvd
- 2225 Garfield Ave
- 2175 Reading Blvd
- 2235 Garfield Ave