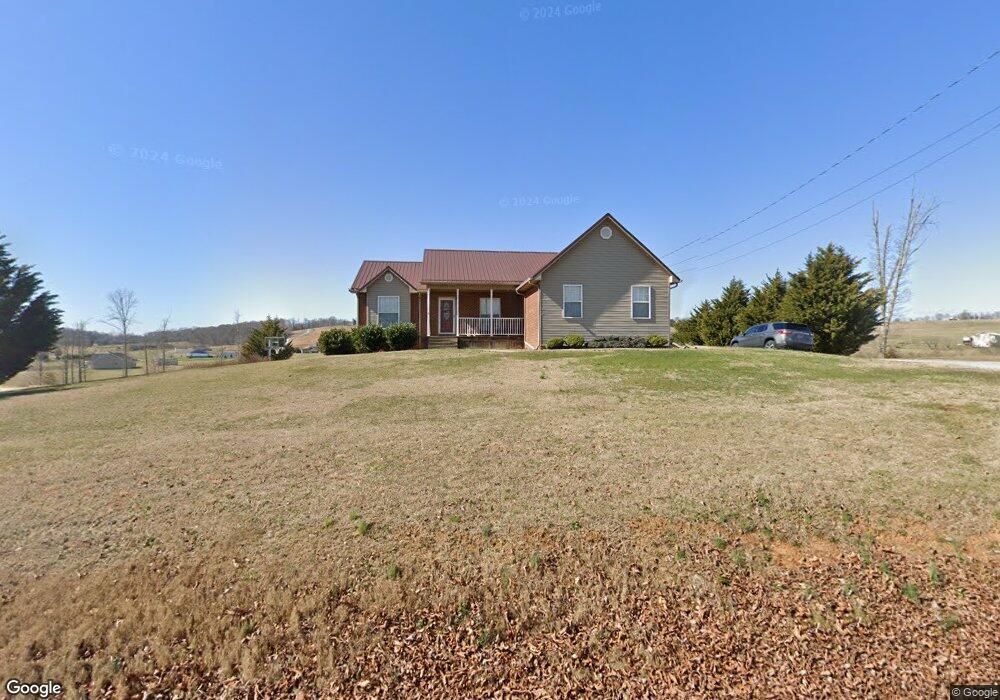
2214 Highway 113 Whitesburg, TN 37891
Estimated Value: $296,000 - $395,000
3
Beds
2
Baths
2,354
Sq Ft
$153/Sq Ft
Est. Value
About This Home
This home is located at 2214 Highway 113, Whitesburg, TN 37891 and is currently estimated at $361,125, approximately $153 per square foot. 2214 Highway 113 is a home located in Hawkins County with nearby schools including Bulls Gap School, St. Clair Elementary School, and Cherokee High School.
Ownership History
Date
Name
Owned For
Owner Type
Purchase Details
Closed on
May 25, 2018
Sold by
Sivert Casey and Sivert Brett
Bought by
Lamb Willard Scott and Lamb Kandice Michelle
Current Estimated Value
Home Financials for this Owner
Home Financials are based on the most recent Mortgage that was taken out on this home.
Original Mortgage
$162,000
Outstanding Balance
$139,487
Interest Rate
4.4%
Mortgage Type
New Conventional
Estimated Equity
$221,638
Purchase Details
Closed on
Dec 18, 2009
Sold by
Citizens Bank
Bought by
Sivert Brett
Home Financials for this Owner
Home Financials are based on the most recent Mortgage that was taken out on this home.
Original Mortgage
$100,001
Interest Rate
4.82%
Purchase Details
Closed on
Jun 25, 2009
Sold by
Simmons Robert
Bought by
Citizens Bank
Purchase Details
Closed on
Aug 14, 2006
Bought by
Simmons Robert and Simmons Joann
Create a Home Valuation Report for This Property
The Home Valuation Report is an in-depth analysis detailing your home's value as well as a comparison with similar homes in the area
Home Values in the Area
Average Home Value in this Area
Purchase History
| Date | Buyer | Sale Price | Title Company |
|---|---|---|---|
| Lamb Willard Scott | $180,000 | None Available | |
| Sivert Brett | $80,000 | -- | |
| Citizens Bank | $119,000 | -- | |
| Simmons Robert | $30,000 | -- |
Source: Public Records
Mortgage History
| Date | Status | Borrower | Loan Amount |
|---|---|---|---|
| Open | Lamb Willard Scott | $162,000 | |
| Previous Owner | Simmons Robert | $100,001 |
Source: Public Records
Tax History Compared to Growth
Tax History
| Year | Tax Paid | Tax Assessment Tax Assessment Total Assessment is a certain percentage of the fair market value that is determined by local assessors to be the total taxable value of land and additions on the property. | Land | Improvement |
|---|---|---|---|---|
| 2024 | $1,337 | $52,350 | $5,325 | $47,025 |
| 2023 | $1,217 | $52,350 | $0 | $0 |
| 2022 | $1,213 | $52,350 | $5,325 | $47,025 |
| 2021 | $1,113 | $52,350 | $5,325 | $47,025 |
| 2020 | $1,079 | $51,350 | $5,325 | $46,025 |
| 2019 | $1,031 | $40,725 | $4,150 | $36,575 |
| 2018 | $1,031 | $40,725 | $4,150 | $36,575 |
| 2017 | $1,031 | $40,725 | $4,150 | $36,575 |
| 2016 | $914 | $40,725 | $4,150 | $36,575 |
| 2015 | $889 | $36,075 | $4,150 | $31,925 |
| 2014 | $966 | $39,175 | $4,150 | $35,025 |
Source: Public Records
Map
Nearby Homes
- TBD English Rd
- LOT 51 Shirley Dr
- LOT 50 Shirley Dr
- 2252 Highway 113
- 7868 Saint Clair Rd
- lot 8 Harris Town Rd
- 348 Harris Town Rd
- 1938 Needmore Rd
- 114 Robertson Creek Rd
- 2840 Three Springs Rd
- 0 Harris Town Rd Unit 1308244
- 8091 E Andrew Johnson Hwy
- Tbd Saint Clair Rd
- 2421 Three Springs Rd
- 625 Silver City Rd
- 1650 Mullins Rd
- 670 Bulls Gap-Saint Clair Rd
- 670 Bulls Gap Saint Clair Rd
- 1781 Mullins Rd
- 471 Chelaque Way
- 2214 Tennessee 113
- 2222 Highway 113
- 2222 Highway 113
- 2203 Tennessee 113
- 0 Long Rd
- 191 English Rd
- 2224 Tennessee 113 Unit 117
- 101 Long Rd
- 2228 Highway 113
- 2232 Tennessee 113
- 128 English Rd
- 2232 Highway 113
- 113 Long Rd
- 2221 Highway 113
- 2160 Tennessee 113
- 2160 Highway 113
- Lot 38 Jerry English Rd
- Lot 11 Jerry English Rd
- Lot 10 Jerry English Rd
- Lot 39 Jerry English Rd