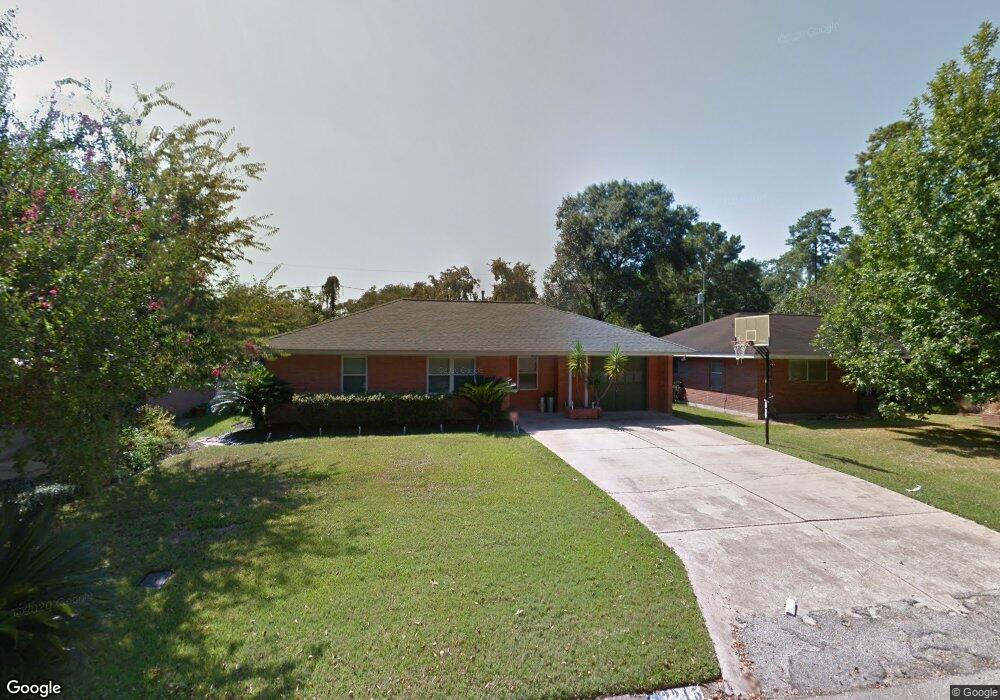
2215 Libbey Dr Houston, TX 77018
Oak Forest-Garden Oaks NeighborhoodEstimated Value: $470,000 - $603,000
3
Beds
2
Baths
1,523
Sq Ft
$351/Sq Ft
Est. Value
About This Home
This home is located at 2215 Libbey Dr, Houston, TX 77018 and is currently estimated at $535,201, approximately $351 per square foot. 2215 Libbey Dr is a home located in Harris County with nearby schools including Stevens Elementary School, Frank Black Middle School, and Waltrip High School.
Ownership History
Date
Name
Owned For
Owner Type
Purchase Details
Closed on
Aug 7, 2007
Sold by
Peters Todd W and Peters Lisa M
Bought by
Salinas Renita R and Meade Jason F
Current Estimated Value
Home Financials for this Owner
Home Financials are based on the most recent Mortgage that was taken out on this home.
Original Mortgage
$188,000
Outstanding Balance
$119,215
Interest Rate
6.69%
Mortgage Type
Purchase Money Mortgage
Estimated Equity
$415,986
Purchase Details
Closed on
Jun 13, 2002
Sold by
Hensley Peggy T and Hensley Sousa Peggy T
Bought by
Peters Todd W and Peters Lisa M
Home Financials for this Owner
Home Financials are based on the most recent Mortgage that was taken out on this home.
Original Mortgage
$95,950
Interest Rate
6.77%
Purchase Details
Closed on
May 20, 1997
Sold by
Hughes Carol Lea
Bought by
Hensley Peggy T
Home Financials for this Owner
Home Financials are based on the most recent Mortgage that was taken out on this home.
Original Mortgage
$71,250
Interest Rate
8.12%
Create a Home Valuation Report for This Property
The Home Valuation Report is an in-depth analysis detailing your home's value as well as a comparison with similar homes in the area
Home Values in the Area
Average Home Value in this Area
Purchase History
| Date | Buyer | Sale Price | Title Company |
|---|---|---|---|
| Salinas Renita R | -- | Startex Title Company | |
| Peters Todd W | -- | -- | |
| Hensley Peggy T | -- | First American Title |
Source: Public Records
Mortgage History
| Date | Status | Borrower | Loan Amount |
|---|---|---|---|
| Open | Salinas Renita R | $188,000 | |
| Previous Owner | Peters Todd W | $95,950 | |
| Previous Owner | Hensley Peggy T | $71,250 | |
| Closed | Peters Todd W | $17,999 |
Source: Public Records
Tax History Compared to Growth
Tax History
| Year | Tax Paid | Tax Assessment Tax Assessment Total Assessment is a certain percentage of the fair market value that is determined by local assessors to be the total taxable value of land and additions on the property. | Land | Improvement |
|---|---|---|---|---|
| 2025 | $7,724 | $551,012 | $380,328 | $170,684 |
| 2024 | $7,724 | $526,528 | $358,386 | $168,142 |
| 2023 | $7,724 | $489,651 | $358,386 | $131,265 |
| 2022 | $9,325 | $455,735 | $314,502 | $141,233 |
| 2021 | $8,973 | $397,565 | $270,618 | $126,947 |
| 2020 | $8,476 | $350,000 | $270,618 | $79,382 |
| 2019 | $9,350 | $401,563 | $270,618 | $130,945 |
| 2018 | $6,532 | $335,903 | $219,420 | $116,483 |
| 2017 | $8,494 | $335,903 | $219,420 | $116,483 |
| 2016 | $8,370 | $422,244 | $219,420 | $202,824 |
| 2015 | $5,476 | $422,244 | $219,420 | $202,824 |
| 2014 | $5,476 | $343,666 | $138,966 | $204,700 |
Source: Public Records
Map
Nearby Homes
- 2111 Nina Lee Ln
- 2106 Nina Lee Ln
- 2211 Libbey Dr
- 2202 Hewitt Dr
- 2214 Hewitt Dr
- 2302 Hewitt Dr
- 2103 Brimberry St
- 2007 Hewitt Dr
- 2202 De Milo Dr
- 2114 Saxon Dr
- 2023 Viking Dr
- 1818 Nina Lee Ln
- 4218 T C Jester Blvd
- 2211 Saxon Dr
- 2019 Saxon Dr
- 2231 Latexo Dr
- 2311 Saxon Dr
- 2314 Hialeah Dr
- 2318 Hialeah Dr
- 2007 Lamonte Ln
- 2219 Libbey Dr
- 2206 Hewitt Dr
- 2207 Libbey Dr
- 2223 Libbey Dr
- 2210 Hewitt Dr
- 2214 Libbey Dr
- 2206 Libbey Dr
- 2222 Libbey Dr
- 2218 Hewitt Dr
- 2114 Hewitt Dr
- 2303 Libbey Dr
- 2226 Libbey Dr
- 2202 Libbey Dr
- 2111 Libbey Dr
- 2207 Hewitt Dr
- 2110 Hewitt Dr
- 2302 Libbey Dr
- 2115 Nina Lee Ln
- 2307 Libbey Dr
- 2119 Nina Lee Ln