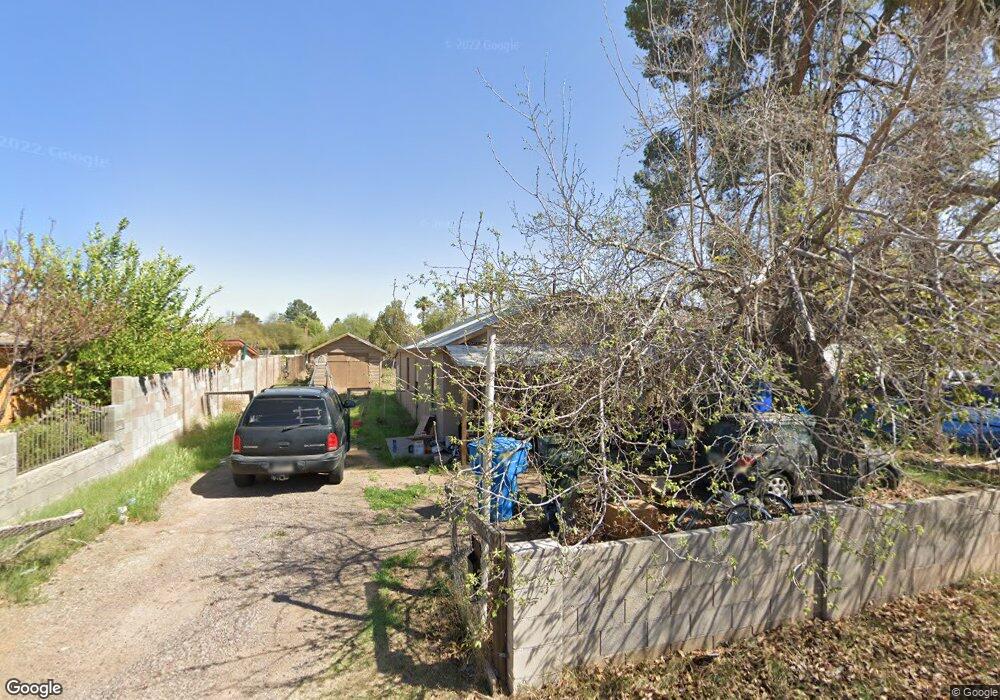
2215 N 26th St Phoenix, AZ 85008
Central City NeighborhoodEstimated Value: $254,000 - $300,000
Studio
1
Bath
924
Sq Ft
$299/Sq Ft
Est. Value
About This Home
This home is located at 2215 N 26th St, Phoenix, AZ 85008 and is currently estimated at $276,269, approximately $298 per square foot. 2215 N 26th St is a home located in Maricopa County with nearby schools including The Creighton Academy, Camelback High School, and Phoenix Coding Academy.
Ownership History
Date
Name
Owned For
Owner Type
Purchase Details
Closed on
Jul 28, 2014
Sold by
Garcia Ubaldo
Bought by
Ubaldo & Magdalena Garcia Living Trust
Current Estimated Value
Purchase Details
Closed on
Apr 3, 2001
Sold by
Alvarez Francisco
Bought by
Garcia Ubaldo and Garcia Magdalena
Home Financials for this Owner
Home Financials are based on the most recent Mortgage that was taken out on this home.
Original Mortgage
$49,750
Outstanding Balance
$18,285
Interest Rate
6.98%
Mortgage Type
New Conventional
Estimated Equity
$257,984
Purchase Details
Closed on
Jul 7, 2000
Sold by
Wingo Marcus Allen
Bought by
Alvarez Francisco and Alvarez Teofila
Home Financials for this Owner
Home Financials are based on the most recent Mortgage that was taken out on this home.
Original Mortgage
$71,889
Interest Rate
8.55%
Mortgage Type
FHA
Create a Home Valuation Report for This Property
The Home Valuation Report is an in-depth analysis detailing your home's value as well as a comparison with similar homes in the area
Home Values in the Area
Average Home Value in this Area
Purchase History
We collect this data history from publicly available records. To have your information removed, we recommend requesting removal directly through your county’s website.
| Date | Buyer | Sale Price | Title Company |
|---|---|---|---|
| Ubaldo & Magdalena Garcia Living Trust | -- | None Available | |
| Garcia Ubaldo | $77,500 | Stewart Title & Trust | |
| Alvarez Francisco | $72,000 | Fidelity National Title |
Source: Public Records
Mortgage History
We collect this data history from publicly available records. To have your information removed, we recommend requesting removal directly through your county’s website.
| Date | Status | Borrower | Loan Amount |
|---|---|---|---|
| Open | Garcia Ubaldo | $49,750 | |
| Previous Owner | Alvarez Francisco | $71,889 | |
| Closed | Garcia Ubaldo | $20,000 |
Source: Public Records
Tax History
| Year | Tax Paid | Tax Assessment Tax Assessment Total Assessment is a certain percentage of the fair market value that is determined by local assessors to be the total taxable value of land and additions on the property. | Land | Improvement |
|---|---|---|---|---|
| 2025 | $974 | $7,214 | -- | -- |
| 2024 | $927 | $6,870 | -- | -- |
| 2023 | $927 | $21,230 | $4,240 | $16,990 |
| 2022 | $891 | $16,820 | $3,360 | $13,460 |
| 2021 | $912 | $15,920 | $3,180 | $12,740 |
| 2020 | $890 | $11,860 | $2,370 | $9,490 |
| 2019 | $884 | $9,800 | $1,960 | $7,840 |
| 2018 | $866 | $8,080 | $1,610 | $6,470 |
| 2017 | $832 | $6,510 | $1,300 | $5,210 |
| 2016 | $386 | $4,310 | $860 | $3,450 |
| 2015 | $359 | $3,480 | $690 | $2,790 |
Source: Public Records
Map
Nearby Homes
- 2126 N 25th Place
- 2601 E Harvard St
- 2101 N 25th Place
- 2221 N 27th St
- 1816 N 25th Place
- 2226 N 28th St
- 2405 N 27th Place
- 2601 E Virginia Ave
- 2245 N 28th St
- 2320 E Harvard St
- 2601 N 27th St Unit 4
- 2314 E Harvard St Unit 2
- 2301 E Harvard St Unit 4
- 2708 N 26th Place
- 2329 N 29th St
- 2242 E Harvard St
- 2201 N 29th Place
- 2302 E Yale St
- 2930 E Granada Rd
- 2217 E Sheridan St
- 2217 N 26th St
- 2602 E Monte Vista Rd
- 2610 E Monte Vista Rd
- 2610 E Monte Vista Rd Unit 1
- 2610 E Monte Vista Rd Unit 4
- 2610 E Monte Vista Rd Unit 2
- 2610 E Monte Vista Rd Unit 111
- 2610 E Monte Vista Rd Unit 113
- 2610 E Monte Vista Rd Unit 108
- 2610 E Monte Vista Rd Unit 110
- 2610 E Monte Vista Rd Unit 112
- 2610 E Monte Vista Rd Unit 114
- 2610 E Monte Vista Rd Unit 109
- 2610 E Monte Vista Rd Unit 107
- 2208 N 26th St
- 2206 N 26th St
- 2614 E Monte Vista Rd
- 2614 E Monte Vista Rd Unit 4
- 2614 E Monte Vista Rd Unit 2
- 2614 E Monte Vista Rd
Your Personal Tour Guide
Ask me questions while you tour the home.