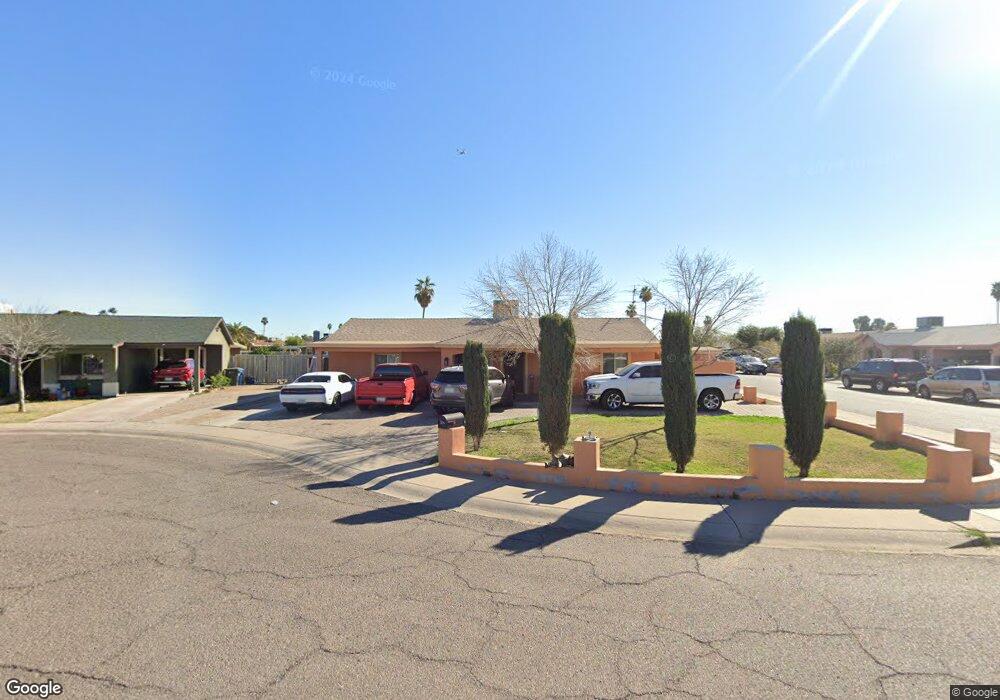
2215 N 68th Ave Phoenix, AZ 85035
Estimated Value: $288,109 - $365,000
Studio
1
Bath
1,484
Sq Ft
$226/Sq Ft
Est. Value
About This Home
This home is located at 2215 N 68th Ave, Phoenix, AZ 85035 and is currently estimated at $334,777, approximately $225 per square foot. 2215 N 68th Ave is a home located in Maricopa County with nearby schools including Peralta School, Raul H. Castro Middle School, and Trevor Browne High School.
Ownership History
Date
Name
Owned For
Owner Type
Purchase Details
Closed on
Apr 20, 1999
Sold by
Loma Celestino Pedroza and Pedroza Celestino
Bought by
Corrales Jose Dominguez
Current Estimated Value
Purchase Details
Closed on
Oct 26, 1998
Sold by
Dominguez Edna Rocio
Bought by
Dominguez Corrales Jose
Home Financials for this Owner
Home Financials are based on the most recent Mortgage that was taken out on this home.
Original Mortgage
$63,752
Interest Rate
6.71%
Mortgage Type
FHA
Purchase Details
Closed on
Oct 7, 1995
Sold by
Mills Diane
Bought by
Paglusch Helen R and Goodman Mary Ellen
Purchase Details
Closed on
Sep 30, 1995
Sold by
Schroeder Stanley C and Schroeder Susan G
Bought by
Paglusch Helen R
Create a Home Valuation Report for This Property
The Home Valuation Report is an in-depth analysis detailing your home's value as well as a comparison with similar homes in the area
Purchase History
| Date | Buyer | Sale Price | Title Company |
|---|---|---|---|
| Corrales Jose Dominguez | -- | -- | |
| Dominguez Corrales Jose | -- | Chicago Title Insurance Co | |
| Corrales Jose Dominguez | $64,000 | Chicago Title Insurance Co | |
| Paglusch Helen R | -- | Chicago Title Insurance Co | |
| Mills Diane | -- | Chicago Title Insurance Co | |
| Paglusch Helen R | $35,900 | Chicago Title Insurance Co |
Source: Public Records
Mortgage History
| Date | Status | Borrower | Loan Amount |
|---|---|---|---|
| Previous Owner | Corrales Jose Dominguez | $63,752 |
Source: Public Records
Tax History
| Year | Tax Paid | Tax Assessment Tax Assessment Total Assessment is a certain percentage of the fair market value that is determined by local assessors to be the total taxable value of land and additions on the property. | Land | Improvement |
|---|---|---|---|---|
| 2025 | $1,136 | $7,126 | -- | -- |
| 2024 | $1,133 | $6,787 | -- | -- |
| 2023 | $1,133 | $23,050 | $4,610 | $18,440 |
| 2022 | $1,064 | $17,300 | $3,460 | $13,840 |
| 2021 | $1,086 | $15,630 | $3,120 | $12,510 |
| 2020 | $1,025 | $14,260 | $2,850 | $11,410 |
| 2019 | $978 | $12,410 | $2,480 | $9,930 |
| 2018 | $1,022 | $11,610 | $2,320 | $9,290 |
| 2017 | $975 | $9,430 | $1,880 | $7,550 |
| 2016 | $931 | $8,280 | $1,650 | $6,630 |
| 2015 | $859 | $7,130 | $1,420 | $5,710 |
Source: Public Records
Map
Nearby Homes
- 6805 W Encanto Blvd
- 6814 W Berkeley Rd
- 6825 W Vernon Ave
- 6929 W Monte Vista Rd
- 6806 W Lewis Ave
- 2042 N 64th Dr
- 2314 N 71st Dr
- 7127 W Holly St
- 7139 W Palm Ln
- 7139 W Wilshire Dr
- 6423 W Almeria Rd
- 8021 W Granada Rd
- 2223 N 62nd Ln
- 7221 W Virginia Ave
- 2419 N 73rd Ln
- 1616 N 63rd Ave Unit 30
- 1616 N 63rd Ave Unit 48
- 2366 N 73rd Ln
- 2546 N 73rd Dr
- 6946 W Merrell St
- 2221 N 68th Ave
- 2216 N 67th Cir
- 6805 W Monte Vista Rd
- 2222 N 67th Cir
- 6743 W Monte Vista Rd
- 6809 W Monte Vista Rd
- 2225 N 68th Ave Unit 5
- 2216 N 68th Ave Unit 5
- 6737 W Monte Vista Rd
- 6815 W Monte Vista Rd
- 2222 N 68th Ave
- 2225 N 67th Cir
- 6811 W Cypress St
- 6805 W Cypress St Unit 5
- 6733 W Monte Vista Rd Unit 5
- 6804 W Holly St
- 6819 W Monte Vista Rd Unit 5
- 6808 W Holly St
- 6815 W Cypress St
- 6752 W Holly St
Your Personal Tour Guide
Ask me questions while you tour the home.