Estimated Value: $327,337 - $365,000
3
Beds
2
Baths
1,899
Sq Ft
$184/Sq Ft
Est. Value
About This Home
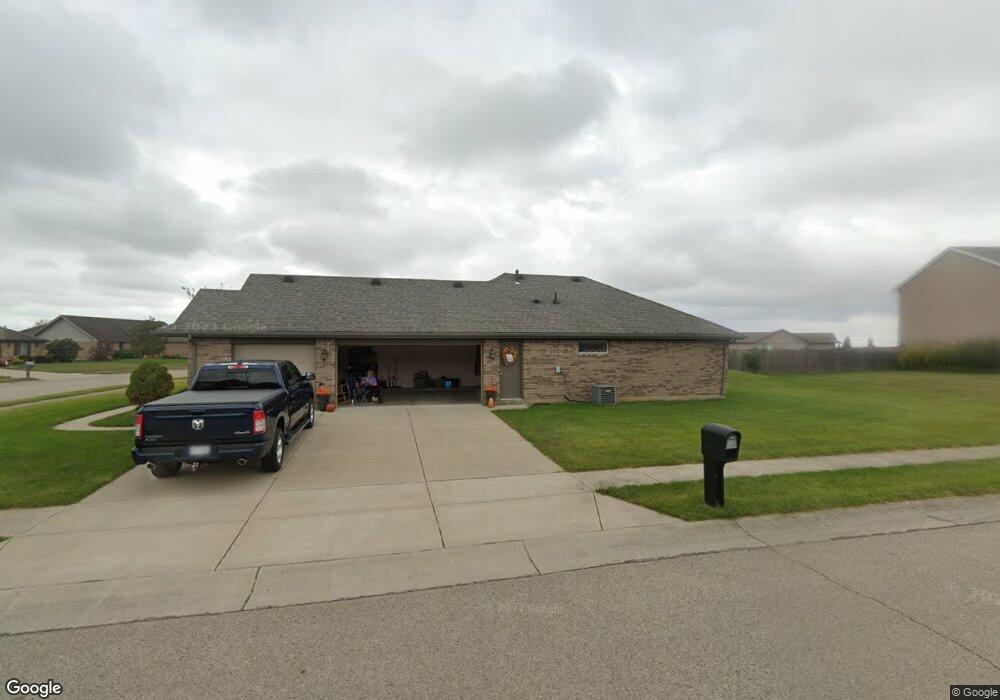
This home is located at 2216 Carousel Dr, Xenia, OH 45385 and is currently estimated at $349,334, approximately $183 per square foot. 2216 Carousel Dr is a home located in Greene County with nearby schools including Xenia High School, Summit Academy Community School for Alternative Learners - Xenia, and Legacy Christian Academy.
Ownership History
Date
Name
Owned For
Owner Type
Purchase Details
Closed on
Aug 18, 2020
Sold by
Roe Gregory O and Roe Kelli L
Bought by
Ball Dennis E and Ball Amanda J
Current Estimated Value
Home Financials for this Owner
Home Financials are based on the most recent Mortgage that was taken out on this home.
Original Mortgage
$228,000
Outstanding Balance
$201,875
Interest Rate
2.9%
Mortgage Type
New Conventional
Estimated Equity
$147,459
Purchase Details
Closed on
Aug 4, 2010
Sold by
Rowland John E and Rowland Patricia L
Bought by
Roe Gregory O and Roe Kelli L
Home Financials for this Owner
Home Financials are based on the most recent Mortgage that was taken out on this home.
Original Mortgage
$152,000
Interest Rate
4.7%
Mortgage Type
New Conventional
Purchase Details
Closed on
Dec 17, 2008
Sold by
Rowland John E and Rowland Patricia L
Bought by
Rowland John E and Rowland Patricia L
Create a Home Valuation Report for This Property
The Home Valuation Report is an in-depth analysis detailing your home's value as well as a comparison with similar homes in the area
Home Values in the Area
Average Home Value in this Area
Purchase History
| Date | Buyer | Sale Price | Title Company |
|---|---|---|---|
| Ball Dennis E | $240,000 | Premier Service Ttl Agcy Llc | |
| Roe Gregory O | $38,000 | None Available | |
| Rowland John E | -- | Attorney |
Source: Public Records
Mortgage History
| Date | Status | Borrower | Loan Amount |
|---|---|---|---|
| Open | Ball Dennis E | $228,000 | |
| Previous Owner | Roe Gregory O | $152,000 |
Source: Public Records
Tax History Compared to Growth
Tax History
| Year | Tax Paid | Tax Assessment Tax Assessment Total Assessment is a certain percentage of the fair market value that is determined by local assessors to be the total taxable value of land and additions on the property. | Land | Improvement |
|---|---|---|---|---|
| 2024 | $4,026 | $94,090 | $16,960 | $77,130 |
| 2023 | $4,026 | $94,090 | $16,960 | $77,130 |
| 2022 | $3,716 | $74,080 | $13,050 | $61,030 |
| 2021 | $3,766 | $73,750 | $13,050 | $60,700 |
| 2020 | $3,593 | $73,750 | $13,050 | $60,700 |
| 2019 | $3,206 | $61,950 | $13,610 | $48,340 |
| 2018 | $3,218 | $61,950 | $13,610 | $48,340 |
| 2017 | $3,125 | $61,950 | $13,610 | $48,340 |
| 2016 | $3,280 | $61,950 | $13,610 | $48,340 |
| 2015 | $3,289 | $61,950 | $13,610 | $48,340 |
| 2014 | $3,149 | $61,950 | $13,610 | $48,340 |
Source: Public Records
Map
Nearby Homes
- 1872 Harris Ln
- 1968 El Camino Dr
- 1815 Promenade Ln
- 493 Hollywood Blvd
- 499 Hollywood Blvd
- 1820 Palmer Ct
- 1814 Palmer Ct
- 1808 Palmer Ct
- 1802 Palmer Ct
- 1791 Palmer Ct
- 1796 Palmer Ct
- 2094 Malibu Trail
- 517 Hollywood Blvd
- 523 Hollywood Blvd
- 532 Hollywood Blvd
- Harmony Plan at Grandstone Trace
- Newcastle Plan at Grandstone Trace
- Pendleton Plan at Grandstone Trace
- Bellamy Plan at Grandstone Trace
- Chatham Plan at Grandstone Trace
- 2220 Carousel Dr
- 1880 Promenade Ln
- 1871 Promenade Ln
- 2228 Carousel Dr
- 1854 Promenade Ln
- 1881 Promenade Ln
- 1863 Promenade Ln
- 2219 Carousel Dr
- 1857 Promenade Ln
- 1855 Promenade Ln
- 2223 Carousel Dr
- 2236 Carousel Dr
- 2218 Sierra Trail
- 1844 Promenade Ln
- 2231 Carousel Dr
- 2208 Sierra Trail
- 1880 Harris Ln
- 1847 Promenade Ln
- 2228 Sierra Trail
- 2239 Sierra Trail