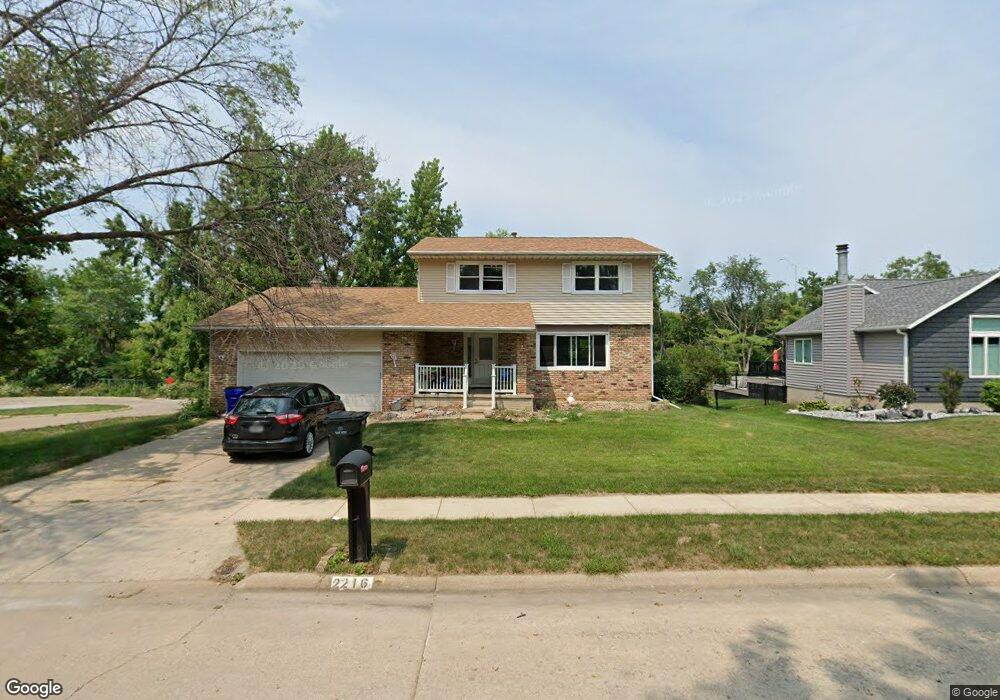
2216 Deb Ann Ln NE Cedar Rapids, IA 52402
Estimated Value: $275,000 - $304,000
3
Beds
3
Baths
1,906
Sq Ft
$150/Sq Ft
Est. Value
About This Home
This home is located at 2216 Deb Ann Ln NE, Cedar Rapids, IA 52402 and is currently estimated at $285,117, approximately $149 per square foot. 2216 Deb Ann Ln NE is a home located in Linn County with nearby schools including Pierce Elementary School, Franklin Middle School, and John F. Kennedy High School.
Ownership History
Date
Name
Owned For
Owner Type
Purchase Details
Closed on
Apr 25, 2000
Sold by
Maytag Corp
Bought by
Executive Development Llc
Current Estimated Value
Purchase Details
Closed on
Aug 18, 1999
Sold by
Allie Thomas K and Allie Kathleen A
Bought by
Calvert Steven L and Calvert Julie L
Home Financials for this Owner
Home Financials are based on the most recent Mortgage that was taken out on this home.
Original Mortgage
$91,350
Interest Rate
7.61%
Purchase Details
Closed on
Oct 10, 1997
Sold by
Ottoson Terri J
Bought by
Allie Thomas K and Allie Kathleen A
Home Financials for this Owner
Home Financials are based on the most recent Mortgage that was taken out on this home.
Original Mortgage
$120,000
Interest Rate
7.7%
Create a Home Valuation Report for This Property
The Home Valuation Report is an in-depth analysis detailing your home's value as well as a comparison with similar homes in the area
Home Values in the Area
Average Home Value in this Area
Purchase History
| Date | Buyer | Sale Price | Title Company |
|---|---|---|---|
| Executive Development Llc | -- | -- | |
| Calvert Steven L | $135,500 | -- | |
| Allie Thomas K | $119,500 | -- |
Source: Public Records
Mortgage History
| Date | Status | Borrower | Loan Amount |
|---|---|---|---|
| Previous Owner | Calvert Steven L | $91,350 | |
| Previous Owner | Allie Thomas K | $120,000 |
Source: Public Records
Tax History Compared to Growth
Tax History
| Year | Tax Paid | Tax Assessment Tax Assessment Total Assessment is a certain percentage of the fair market value that is determined by local assessors to be the total taxable value of land and additions on the property. | Land | Improvement |
|---|---|---|---|---|
| 2025 | $4,478 | $281,400 | $49,100 | $232,300 |
| 2024 | $4,874 | $261,300 | $49,100 | $212,200 |
| 2023 | $4,874 | $253,100 | $45,300 | $207,800 |
| 2022 | $4,222 | $231,100 | $45,300 | $185,800 |
| 2021 | $4,156 | $203,800 | $37,800 | $166,000 |
| 2020 | $4,156 | $188,400 | $37,800 | $150,600 |
| 2019 | $3,752 | $174,100 | $35,900 | $138,200 |
| 2018 | $3,650 | $174,100 | $35,900 | $138,200 |
| 2017 | $3,828 | $175,800 | $35,900 | $139,900 |
| 2016 | $3,620 | $170,300 | $35,900 | $134,400 |
| 2015 | $3,670 | $172,515 | $30,219 | $142,296 |
| 2014 | $3,670 | $172,515 | $30,219 | $142,296 |
| 2013 | $1,796 | $172,515 | $30,219 | $142,296 |
Source: Public Records
Map
Nearby Homes
- 4609 White Pine Dr NE
- 4216 Marilyn Dr NE
- 2106 42nd St NE
- 4761 Westchester Dr NE Unit C
- 4460 Westchester Dr NE Unit C
- 4745 Westchester Dr NE Unit A
- 4645 Westchester Dr NE Unit A
- 4545 Westchester Dr NE Unit D
- 2520 Falbrook Dr NE
- 5455 Blairs Ferry Rd NE
- 3858 Northwood Dr NE
- 2400 Brookland Dr NE
- 1638 47th St NE
- 105 W Willman St
- 4433 Coventry Ln NE
- 306 10th Ave
- 1006 Messina Dr NE
- 1138 Messina Dr NE
- 2611 Brookland Dr NE
- 109 E Willman St
- 2210 Deb Ann Ln NE
- 4656 Northwood Dr NE
- 4673 Northwood Dr NE
- 4663 Northwood Dr NE
- 4653 Northwood Dr NE
- 4646 Northwood Dr NE
- 2200 Deb Ann Ln NE
- 2203 Deb Ann Ln NE
- 2311 Ryan Ln NE
- 4643 Northwood Dr NE
- 4636 Northwood Dr NE
- 2312 Towne House Dr NE
- 2317 Ryan Ln NE
- 4645 Janet Place NE
- 2192 Deb Ann Ln NE
- 2316 Towne House Dr NE
- 4642 Marsue Cir NE
- 4626 Northwood Dr NE
- 4635 Janet Place NE
- 2189 Deb Ann Ln NE