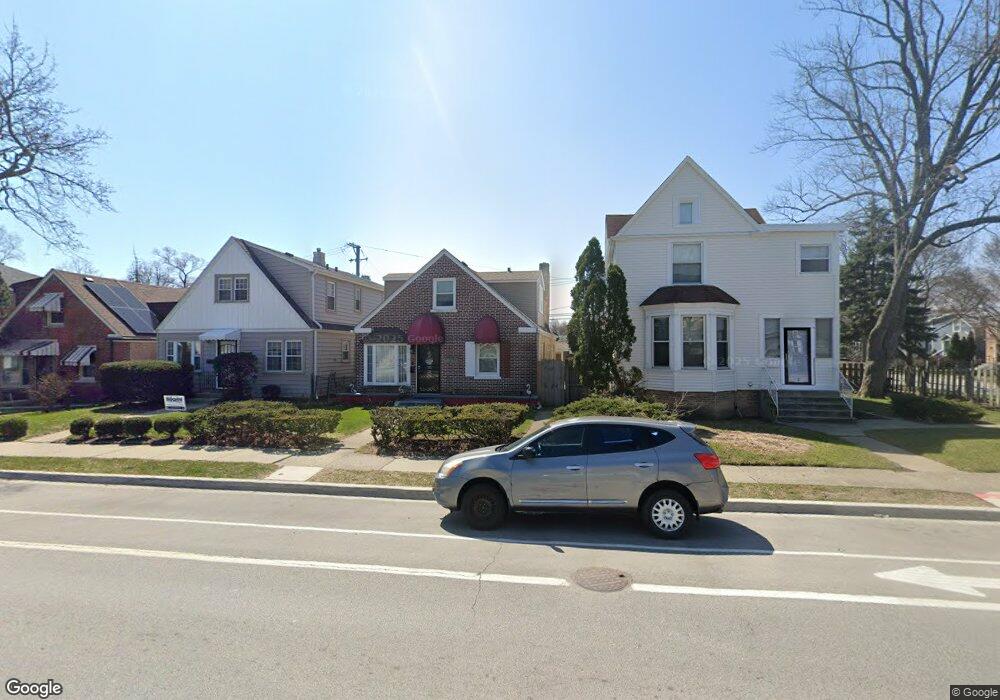
2216 Emerson St Evanston, IL 60201
West Evanston NeighborhoodEstimated Value: $363,000 - $470,421
4
Beds
2
Baths
1,311
Sq Ft
$301/Sq Ft
Est. Value
About This Home
This home is located at 2216 Emerson St, Evanston, IL 60201 and is currently estimated at $395,105, approximately $301 per square foot. 2216 Emerson St is a home located in Cook County with nearby schools including Lincolnwood Elementary School, Haven Middle School, and Evanston Township High School.
Ownership History
Date
Name
Owned For
Owner Type
Purchase Details
Closed on
Aug 1, 2006
Sold by
Hilton Cherylette
Bought by
Delva Frank and Delva Saradienne
Current Estimated Value
Home Financials for this Owner
Home Financials are based on the most recent Mortgage that was taken out on this home.
Original Mortgage
$273,280
Outstanding Balance
$173,728
Interest Rate
7.87%
Mortgage Type
Unknown
Estimated Equity
$221,377
Purchase Details
Closed on
Feb 21, 2006
Sold by
Hilton Cherylette
Bought by
Hilton Cherylette and Cherylette Hilton Revocable Trust
Home Financials for this Owner
Home Financials are based on the most recent Mortgage that was taken out on this home.
Original Mortgage
$160,000
Interest Rate
10%
Mortgage Type
Fannie Mae Freddie Mac
Purchase Details
Closed on
Feb 1, 2006
Sold by
Thomas Victoria
Bought by
Hilton Cherylette
Home Financials for this Owner
Home Financials are based on the most recent Mortgage that was taken out on this home.
Original Mortgage
$160,000
Interest Rate
10%
Mortgage Type
Fannie Mae Freddie Mac
Create a Home Valuation Report for This Property
The Home Valuation Report is an in-depth analysis detailing your home's value as well as a comparison with similar homes in the area
Home Values in the Area
Average Home Value in this Area
Purchase History
| Date | Buyer | Sale Price | Title Company |
|---|---|---|---|
| Delva Frank | $342,000 | None Available | |
| Delva Frank | $342,000 | None Available | |
| Hilton Cherylette | -- | None Available | |
| Hilton Cherylette | $200,000 | Cst |
Source: Public Records
Mortgage History
| Date | Status | Borrower | Loan Amount |
|---|---|---|---|
| Open | Delva Frank | $273,280 | |
| Closed | Delva Frank | $273,280 | |
| Previous Owner | Hilton Cherylette | $160,000 |
Source: Public Records
Tax History Compared to Growth
Tax History
| Year | Tax Paid | Tax Assessment Tax Assessment Total Assessment is a certain percentage of the fair market value that is determined by local assessors to be the total taxable value of land and additions on the property. | Land | Improvement |
|---|---|---|---|---|
| 2024 | $6,944 | $26,079 | $4,500 | $21,579 |
| 2023 | $6,639 | $32,000 | $4,500 | $27,500 |
| 2022 | $6,639 | $32,000 | $4,500 | $27,500 |
| 2021 | $5,125 | $22,641 | $4,125 | $18,516 |
| 2020 | $5,116 | $22,641 | $4,125 | $18,516 |
| 2019 | $5,144 | $25,383 | $4,125 | $21,258 |
| 2018 | $4,042 | $18,189 | $3,375 | $14,814 |
| 2017 | $3,953 | $18,189 | $3,375 | $14,814 |
| 2016 | $4,388 | $19,835 | $3,375 | $16,460 |
| 2015 | $3,668 | $16,304 | $2,906 | $13,398 |
| 2014 | $3,648 | $16,304 | $2,906 | $13,398 |
| 2013 | $5,412 | $23,488 | $2,906 | $20,582 |
Source: Public Records
Map
Nearby Homes
- 1808 Laurel Ave
- 1832 Hovland Ct
- 2101 Pioneer Rd
- 1718 Hovland Ct
- 1801 Brown Ave
- 2440 Simpson St
- 1813 Dodge Ave
- 2022 Mcdaniel Ave
- 1739 Dodge Ave
- 1633 Mcdaniel Ave
- 1801 Lyons St
- 2005 Darrow Ave
- 1918 Noyes St
- 1621 Church St
- 1910 Grant St
- 2113 Forestview Rd
- 1915 Grant St
- 2422 Grant St
- 2020 Colfax St
- 3500 Church St Unit 204
- 2212 Emerson St
- 2224 Emerson St
- 2210 Emerson St
- 2226 Emerson St
- 2208 Emerson St
- 1839 Laurel Ave
- 2206 Emerson St
- 1835 Laurel Ave
- 2300 Emerson St
- 1833 Laurel Ave
- 1836 Hartrey Ave
- 1834 Hartrey Ave
- 2304 Emerson St
- 2200 Emerson St
- 2200 Emerson St
- 1829 Laurel Ave
- 2209 Emerson St Unit 2
- 2209 Emerson St
- 2221 Emerson St
- 2217 Emerson St