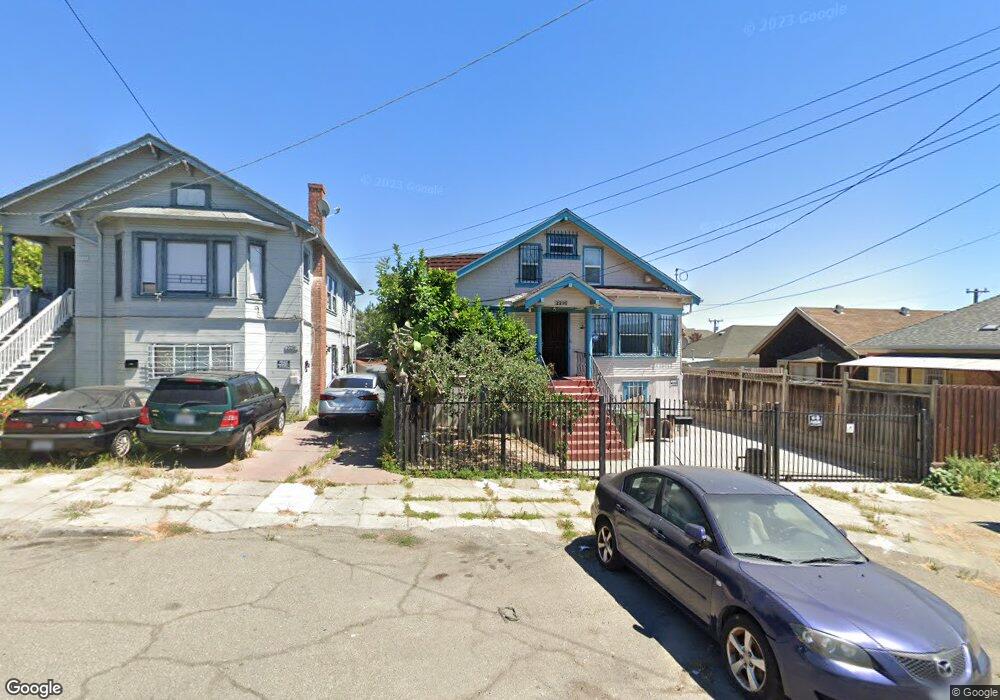
2216 Inyo Ave Oakland, CA 94601
Meadow Brook NeighborhoodEstimated Value: $402,000 - $628,000
2
Beds
1
Bath
1,080
Sq Ft
$474/Sq Ft
Est. Value
About This Home
This home is located at 2216 Inyo Ave, Oakland, CA 94601 and is currently estimated at $512,264, approximately $474 per square foot. 2216 Inyo Ave is a home located in Alameda County with nearby schools including Manzanita Community School, Manzanita Seed Elementary School, and Roosevelt Middle School.
Ownership History
Date
Name
Owned For
Owner Type
Purchase Details
Closed on
Apr 24, 2012
Sold by
Federal National Mortgage Association
Bought by
Jiang Wen Ying
Current Estimated Value
Purchase Details
Closed on
Jun 3, 2011
Sold by
Palacios Francisco
Bought by
Federal National Mortgage Association
Purchase Details
Closed on
Aug 29, 2007
Sold by
Palacios Francisco
Bought by
Palacios Francisco
Home Financials for this Owner
Home Financials are based on the most recent Mortgage that was taken out on this home.
Original Mortgage
$277,000
Interest Rate
6.67%
Mortgage Type
New Conventional
Create a Home Valuation Report for This Property
The Home Valuation Report is an in-depth analysis detailing your home's value as well as a comparison with similar homes in the area
Home Values in the Area
Average Home Value in this Area
Purchase History
| Date | Buyer | Sale Price | Title Company |
|---|---|---|---|
| Jiang Wen Ying | $130,000 | Servicelink | |
| Federal National Mortgage Association | $112,200 | Landsafe | |
| Palacios Francisco | -- | Fidelity National Title Co |
Source: Public Records
Mortgage History
| Date | Status | Borrower | Loan Amount |
|---|---|---|---|
| Previous Owner | Palacios Francisco | $277,000 |
Source: Public Records
Tax History Compared to Growth
Tax History
| Year | Tax Paid | Tax Assessment Tax Assessment Total Assessment is a certain percentage of the fair market value that is determined by local assessors to be the total taxable value of land and additions on the property. | Land | Improvement |
|---|---|---|---|---|
| 2025 | $3,984 | $156,278 | $48,983 | $114,295 |
| 2024 | $3,984 | $153,077 | $48,023 | $112,054 |
| 2023 | $3,931 | $156,938 | $47,081 | $109,857 |
| 2022 | $3,760 | $146,861 | $46,158 | $107,703 |
| 2021 | $3,460 | $143,846 | $45,254 | $105,592 |
| 2020 | $3,418 | $149,300 | $44,790 | $104,510 |
| 2019 | $3,203 | $146,374 | $43,912 | $102,462 |
| 2018 | $3,136 | $143,504 | $43,051 | $100,453 |
| 2017 | $2,983 | $140,691 | $42,207 | $98,484 |
| 2016 | $2,802 | $137,933 | $41,380 | $96,553 |
| 2015 | $2,780 | $135,862 | $40,758 | $95,104 |
| 2014 | $2,760 | $133,201 | $39,960 | $93,241 |
Source: Public Records
Map
Nearby Homes