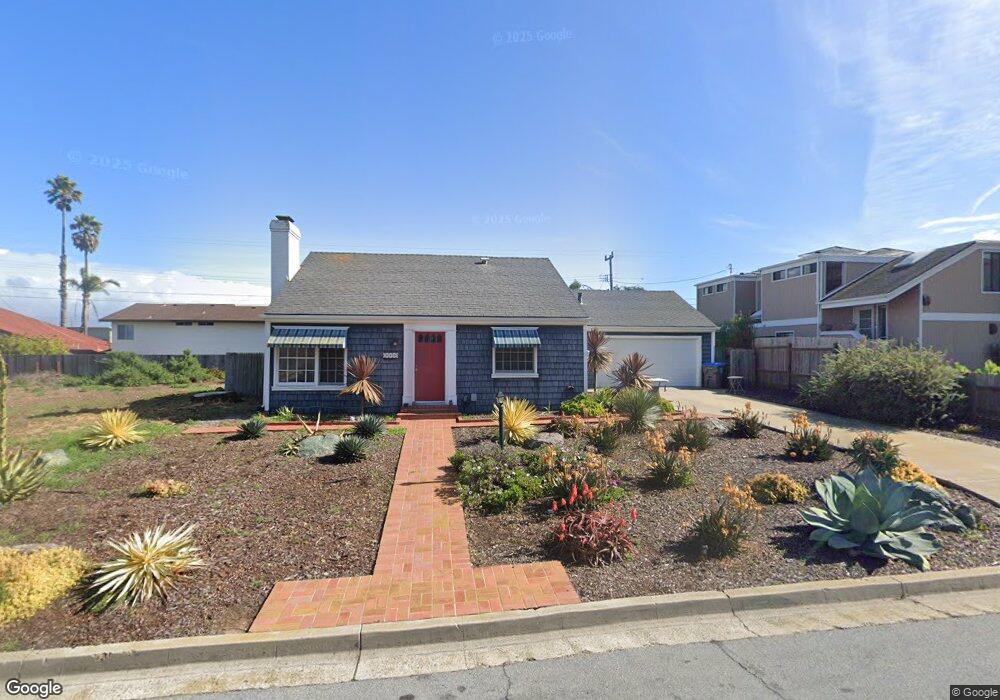
2216 Inyo St Los Osos, CA 93402
Estimated Value: $829,476 - $1,004,000
3
Beds
2
Baths
1,300
Sq Ft
$709/Sq Ft
Est. Value
About This Home
This home is located at 2216 Inyo St, Los Osos, CA 93402 and is currently estimated at $921,619, approximately $708 per square foot. 2216 Inyo St is a home located in San Luis Obispo County with nearby schools including Monarch Grove Elementary School, Los Osos Middle School, and Morro Bay High School.
Ownership History
Date
Name
Owned For
Owner Type
Purchase Details
Closed on
Mar 2, 2007
Sold by
Cook L Paul L and Cook Claudia E
Bought by
Cook L Paul L and Cook Claudia E
Current Estimated Value
Purchase Details
Closed on
Apr 8, 2002
Sold by
Burke Dorothy L and Burke Trust
Bought by
Cook L Paul L and Cook Claudia E
Home Financials for this Owner
Home Financials are based on the most recent Mortgage that was taken out on this home.
Original Mortgage
$288,000
Outstanding Balance
$122,112
Interest Rate
7.13%
Mortgage Type
Seller Take Back
Estimated Equity
$799,507
Purchase Details
Closed on
Mar 25, 1997
Sold by
Burke Dorothy L
Bought by
Burke Dorothy L
Purchase Details
Closed on
Jun 8, 1996
Sold by
Hubbard Ronald A and Lynch Nancy L
Bought by
Burke Donald H and Burke Dorothy L
Create a Home Valuation Report for This Property
The Home Valuation Report is an in-depth analysis detailing your home's value as well as a comparison with similar homes in the area
Home Values in the Area
Average Home Value in this Area
Purchase History
| Date | Buyer | Sale Price | Title Company |
|---|---|---|---|
| Cook L Paul L | -- | None Available | |
| Cook L Paul L | -- | First American Title Co | |
| Burke Dorothy L | -- | -- | |
| Burke Donald H | $200,000 | First American Title Ins |
Source: Public Records
Mortgage History
| Date | Status | Borrower | Loan Amount |
|---|---|---|---|
| Open | Cook L Paul L | $288,000 |
Source: Public Records
Tax History
| Year | Tax Paid | Tax Assessment Tax Assessment Total Assessment is a certain percentage of the fair market value that is determined by local assessors to be the total taxable value of land and additions on the property. | Land | Improvement |
|---|---|---|---|---|
| 2025 | $8,135 | $531,806 | $295,451 | $236,355 |
| 2024 | $8,051 | $521,379 | $289,658 | $231,721 |
| 2023 | $8,051 | $511,157 | $283,979 | $227,178 |
| 2022 | $7,813 | $501,135 | $278,411 | $222,724 |
| 2021 | $7,621 | $491,309 | $272,952 | $218,357 |
| 2020 | $7,284 | $486,273 | $270,154 | $216,119 |
| 2019 | $7,271 | $476,739 | $264,857 | $211,882 |
| 2018 | $7,332 | $467,392 | $259,664 | $207,728 |
| 2017 | $7,175 | $458,228 | $254,573 | $203,655 |
| 2016 | $5,864 | $449,244 | $249,582 | $199,662 |
| 2015 | $5,790 | $442,497 | $245,834 | $196,663 |
| 2014 | $5,212 | $416,000 | $230,000 | $186,000 |
Source: Public Records
Map
Nearby Homes
- 2265 Del Norte St
- 1924 Nevada Ct
- 224 Butte Dr
- 230 Butte Dr
- 2493 San Sebastian Ln
- 200 Madera St
- 286 San Leandro Ave
- 85 Costa Azul
- 0 Garden St
- 305 Henrietta Ave
- 2743 Rodman Dr
- 2045 Pine Ave
- 2796 Crockett Cir
- 1840 Pine Ave
- 1830 Pine Ave
- 0 Ash St
- 1766 Fearn Ave
- 1765 Pine Ave
- 2813 Alamo Dr
- 633 Ramona Ave Unit 19
Your Personal Tour Guide
Ask me questions while you tour the home.