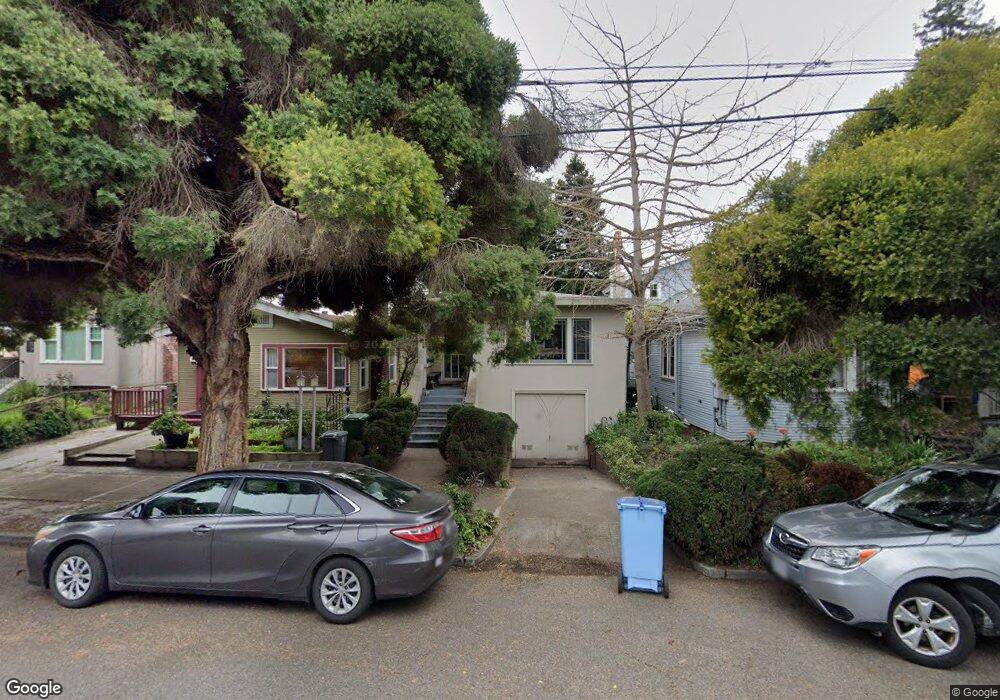
2216 Jefferson Ave Berkeley, CA 94703
Downtown Berkeley NeighborhoodEstimated Value: $1,359,000 - $1,731,000
3
Beds
3
Baths
1,620
Sq Ft
$948/Sq Ft
Est. Value
About This Home
This home is located at 2216 Jefferson Ave, Berkeley, CA 94703 and is currently estimated at $1,535,488, approximately $947 per square foot. 2216 Jefferson Ave is a home located in Alameda County with nearby schools including Washington Elementary School, Oxford Elementary School, and Berkeley Arts Magnet at Whittier School.
Ownership History
Date
Name
Owned For
Owner Type
Purchase Details
Closed on
Oct 22, 2004
Sold by
Yeung Anna and Piccillo Mark
Bought by
Piccillo Mark and Yeung Anna
Current Estimated Value
Home Financials for this Owner
Home Financials are based on the most recent Mortgage that was taken out on this home.
Original Mortgage
$333,700
Outstanding Balance
$164,378
Interest Rate
5.69%
Mortgage Type
New Conventional
Estimated Equity
$1,371,110
Purchase Details
Closed on
Feb 25, 2002
Sold by
Piccillo Mark and Yeung Anna
Bought by
Piccillo Mark and Yeung Anna
Home Financials for this Owner
Home Financials are based on the most recent Mortgage that was taken out on this home.
Original Mortgage
$150,000
Interest Rate
6.94%
Purchase Details
Closed on
Aug 6, 1999
Sold by
Piccillo Mark and Yeung Anna
Bought by
Piccillo Mark and Yeung Anna
Create a Home Valuation Report for This Property
The Home Valuation Report is an in-depth analysis detailing your home's value as well as a comparison with similar homes in the area
Home Values in the Area
Average Home Value in this Area
Purchase History
| Date | Buyer | Sale Price | Title Company |
|---|---|---|---|
| Piccillo Mark | -- | -- | |
| Piccillo Mark | -- | Old Republic Title Company | |
| Piccillo Mark | -- | Fidelity National Title Co | |
| Piccillo Mark | -- | -- |
Source: Public Records
Mortgage History
| Date | Status | Borrower | Loan Amount |
|---|---|---|---|
| Open | Piccillo Mark | $333,700 | |
| Previous Owner | Piccillo Mark | $150,000 |
Source: Public Records
Tax History
| Year | Tax Paid | Tax Assessment Tax Assessment Total Assessment is a certain percentage of the fair market value that is determined by local assessors to be the total taxable value of land and additions on the property. | Land | Improvement |
|---|---|---|---|---|
| 2025 | $9,206 | $452,570 | $114,711 | $344,859 |
| 2024 | $9,206 | $443,560 | $112,462 | $338,098 |
| 2023 | $8,939 | $441,726 | $110,257 | $331,469 |
| 2022 | $8,678 | $426,065 | $108,095 | $324,970 |
| 2021 | $8,671 | $417,575 | $105,976 | $318,599 |
| 2020 | $8,139 | $420,224 | $104,890 | $315,334 |
| 2019 | $7,736 | $411,986 | $102,834 | $309,152 |
| 2018 | $7,572 | $403,909 | $100,818 | $303,091 |
| 2017 | $7,289 | $395,989 | $98,841 | $297,148 |
| 2016 | $6,984 | $388,225 | $96,903 | $291,322 |
| 2015 | $6,873 | $382,395 | $95,448 | $286,947 |
| 2014 | $6,787 | $374,906 | $93,579 | $281,327 |
Source: Public Records
Map
Nearby Homes
- 2118 California St
- 2218 -2222 Grant St
- 2350 Sacramento St
- 2304 Edwards St
- 1512 Hearst Ave Unit 1512
- 1604 Dwight Way
- 1813 Sacramento St
- 2437 Acton St
- 1411 Hearst Ave Unit 2
- 1634 Blake St
- 1431 Dwight Way
- 1436 Delaware St
- 1524 Blake St
- 1516 Blake St
- 1516 Blake St Unit A
- 2533 Grant St
- 1612 Parker St
- 1726 Parker St Unit 2
- 1726 Parker St Unit 1
- 2324 Browning St
- 2218 Jefferson Ave
- 2214 Jefferson Ave
- 2212 Jefferson Ave
- 2220 Jefferson Ave
- 2210 Jefferson Ave
- 2224 Jefferson Ave
- 2206 Jefferson Ave
- 2221 California St
- 2211 California St
- 2225 California St
- 2228 Jefferson Ave
- 2209 California St
- 1612 Allston Way
- 2229 California St
- 1610 Allston Way
- 2202 Jefferson Ave
- 1608 Allston Way
- 2219 Jefferson Ave
- 2207 California St
- 2225 Jefferson Ave
Your Personal Tour Guide
Ask me questions while you tour the home.