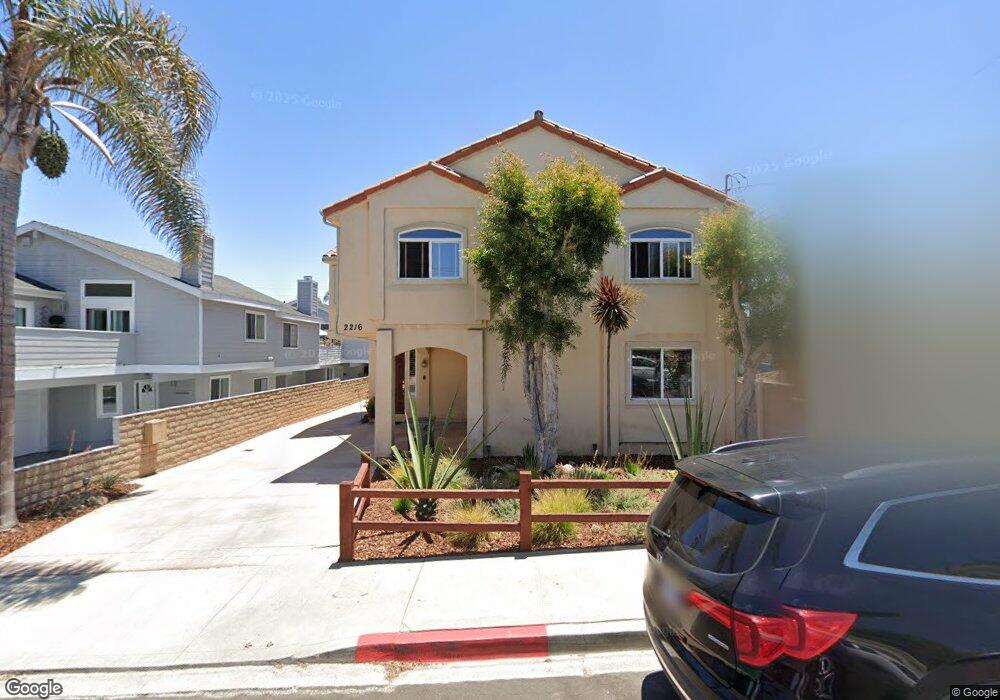
2216 Rockefeller Ln Unit C Redondo Beach, CA 90278
North Redondo Beach NeighborhoodEstimated Value: $1,246,668 - $1,472,000
3
Beds
3
Baths
1,930
Sq Ft
$694/Sq Ft
Est. Value
About This Home
This home is located at 2216 Rockefeller Ln Unit C, Redondo Beach, CA 90278 and is currently estimated at $1,339,167, approximately $693 per square foot. 2216 Rockefeller Ln Unit C is a home located in Los Angeles County with nearby schools including Birney Elementary School, Adams Middle School, and Redondo Union High School.
Ownership History
Date
Name
Owned For
Owner Type
Purchase Details
Closed on
Jul 11, 2025
Sold by
Mcnaught Stuart J and Mcnaught Amy L
Bought by
Mcnaught Family Trust and Mcnaught
Current Estimated Value
Purchase Details
Closed on
Aug 7, 2003
Sold by
The Jane Y Sawai Revocable Trust
Bought by
Mcnaught Stuart J and Mcnaught Amy L
Home Financials for this Owner
Home Financials are based on the most recent Mortgage that was taken out on this home.
Original Mortgage
$462,000
Interest Rate
4.87%
Mortgage Type
Purchase Money Mortgage
Purchase Details
Closed on
May 14, 2001
Sold by
Sawai Jane Y
Bought by
Sawai Jane Y and The Jane Y Sawai Revocable Tru
Purchase Details
Closed on
Jan 29, 2001
Sold by
Agar Grant Town Homes Lp
Bought by
Sawai Jane Y
Home Financials for this Owner
Home Financials are based on the most recent Mortgage that was taken out on this home.
Original Mortgage
$215,000
Interest Rate
6.98%
Create a Home Valuation Report for This Property
The Home Valuation Report is an in-depth analysis detailing your home's value as well as a comparison with similar homes in the area
Home Values in the Area
Average Home Value in this Area
Purchase History
| Date | Buyer | Sale Price | Title Company |
|---|---|---|---|
| Mcnaught Family Trust | -- | None Listed On Document | |
| Mcnaught Stuart J | $580,000 | Investors Title Company | |
| Sawai Jane Y | -- | -- | |
| Sawai Jane Y | $390,000 | Chicago Title Co |
Source: Public Records
Mortgage History
| Date | Status | Borrower | Loan Amount |
|---|---|---|---|
| Previous Owner | Mcnaught Stuart J | $462,000 | |
| Previous Owner | Sawai Jane Y | $215,000 | |
| Closed | Mcnaught Stuart J | $60,000 |
Source: Public Records
Tax History Compared to Growth
Tax History
| Year | Tax Paid | Tax Assessment Tax Assessment Total Assessment is a certain percentage of the fair market value that is determined by local assessors to be the total taxable value of land and additions on the property. | Land | Improvement |
|---|---|---|---|---|
| 2025 | $9,713 | $824,626 | $551,365 | $273,261 |
| 2024 | $9,713 | $808,457 | $540,554 | $267,903 |
| 2023 | $9,538 | $792,605 | $529,955 | $262,650 |
| 2022 | $9,367 | $777,064 | $519,564 | $257,500 |
| 2021 | $9,111 | $761,828 | $509,377 | $252,451 |
| 2019 | $8,892 | $739,233 | $494,269 | $244,964 |
| 2018 | $8,646 | $724,739 | $484,578 | $240,161 |
| 2016 | $8,364 | $696,598 | $465,762 | $230,836 |
| 2015 | $8,212 | $686,135 | $458,766 | $227,369 |
| 2014 | $8,093 | $672,696 | $449,780 | $222,916 |
Source: Public Records
Map
Nearby Homes
- 2317 Carnegie Ln Unit B
- 2210 Harriman Ln Unit A
- 1708 Blossom Ln
- 2100 Carnegie Ln
- 1802 Blossom Ln
- 2720 27201/2 Carnegie Ln
- 2321 Clark Ln Unit B
- 2321 Clark Ln Unit A
- 2021 Carnegie Ln Unit 7
- 2227 Mathews Ave
- 2301 Marshallfield Ln Unit A
- 2405 Mathews Ave Unit C
- 2405 Mathews Ave Unit B
- 2002 Carnegie Ln Unit A
- 2005 Phelan Ln
- 2517 Huntington Ln Unit B
- 2221 Pullman Ln Unit B
- 2213 Nelson Ave
- 2020 Clark Ln Unit B
- 2313 Nelson Ave Unit A
- 2216 Rockefeller Ln Unit B
- 2216 Rockefeller Ln Unit A
- 2218 Rockefeller Ln Unit C
- 2218 Rockefeller Ln Unit B
- 2218 Rockefeller Ln Unit A
- 2214 Rockefeller Ln
- 2220 Rockefeller Ln Unit C
- 2220 Rockefeller Ln Unit B
- 2220 Rockefeller Ln Unit A
- 2212 Rockefeller Ln Unit A
- 2212 Rockefeller Ln Unit C
- 2212 Rockefeller Ln Unit B
- 2222 Rockefeller Ln Unit C
- 2222 Rockefeller Ln Unit B
- 2222 Rockefeller Ln Unit A
- 2210 Rockefeller Ln Unit C
- 2210 Rockefeller Ln Unit B
- 2210 Rockefeller Ln
- 2217 Grant Ave Unit B
- 2217 Grant Ave Unit A