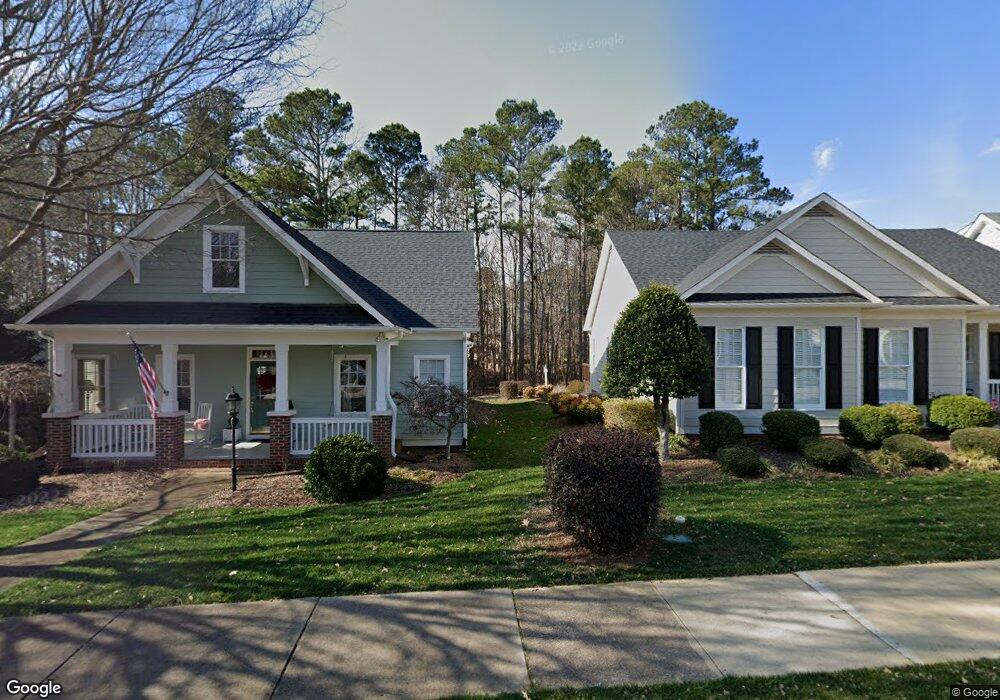
2216 Saltree Place Raleigh, NC 27614
Estimated Value: $584,000 - $712,000
4
Beds
2
Baths
2,314
Sq Ft
$285/Sq Ft
Est. Value
About This Home
This home is located at 2216 Saltree Place, Raleigh, NC 27614 and is currently estimated at $659,365, approximately $284 per square foot. 2216 Saltree Place is a home located in Wake County with nearby schools including Abbotts Creek Elementary School, Wakefield Middle, and Wakefield High School.
Ownership History
Date
Name
Owned For
Owner Type
Purchase Details
Closed on
Mar 25, 2003
Sold by
Old Republic National Title Insurance Co
Bought by
Williford Mary A
Current Estimated Value
Home Financials for this Owner
Home Financials are based on the most recent Mortgage that was taken out on this home.
Original Mortgage
$182,900
Interest Rate
5.86%
Mortgage Type
Balloon
Purchase Details
Closed on
Feb 3, 2003
Sold by
Paton Candace A
Bought by
Old Republic National Title Insurance Co
Home Financials for this Owner
Home Financials are based on the most recent Mortgage that was taken out on this home.
Original Mortgage
$182,900
Interest Rate
5.86%
Mortgage Type
Balloon
Purchase Details
Closed on
Jun 4, 1999
Sold by
Tingen Construction Company Inc
Bought by
Paton Candace A
Home Financials for this Owner
Home Financials are based on the most recent Mortgage that was taken out on this home.
Original Mortgage
$189,900
Interest Rate
6.57%
Create a Home Valuation Report for This Property
The Home Valuation Report is an in-depth analysis detailing your home's value as well as a comparison with similar homes in the area
Home Values in the Area
Average Home Value in this Area
Purchase History
| Date | Buyer | Sale Price | Title Company |
|---|---|---|---|
| Williford Mary A | $262,000 | -- | |
| Old Republic National Title Insurance Co | -- | -- | |
| Paton Candace A | $253,500 | -- |
Source: Public Records
Mortgage History
| Date | Status | Borrower | Loan Amount |
|---|---|---|---|
| Closed | Williford Mary A | $182,900 | |
| Previous Owner | Paton Candace A | $189,900 | |
| Closed | Paton Candace A | $37,950 |
Source: Public Records
Tax History Compared to Growth
Tax History
| Year | Tax Paid | Tax Assessment Tax Assessment Total Assessment is a certain percentage of the fair market value that is determined by local assessors to be the total taxable value of land and additions on the property. | Land | Improvement |
|---|---|---|---|---|
| 2025 | $5,337 | $609,661 | $135,000 | $474,661 |
| 2024 | $5,315 | $609,661 | $135,000 | $474,661 |
| 2023 | $4,466 | $407,906 | $91,000 | $316,906 |
| 2022 | $4,150 | $407,906 | $91,000 | $316,906 |
| 2021 | $3,989 | $407,906 | $91,000 | $316,906 |
| 2020 | $3,860 | $402,025 | $91,000 | $311,025 |
| 2019 | $3,954 | $339,468 | $86,000 | $253,468 |
| 2018 | $3,729 | $339,468 | $86,000 | $253,468 |
| 2017 | $3,551 | $339,468 | $86,000 | $253,468 |
| 2016 | $3,479 | $339,468 | $86,000 | $253,468 |
| 2015 | $3,531 | $339,058 | $86,000 | $253,058 |
| 2014 | $3,349 | $339,058 | $86,000 | $253,058 |
Source: Public Records
Map
Nearby Homes
- 2136 Dunn Rd
- 10415 Ashmead Ln
- 10621 Catara Dr
- 10821 Farmville Rd
- 10907 Flower Bed Ct
- 1804 Falls Landing Dr
- 1808 Falls Landing Dr
- 4615 All Points View Way
- 4406 Crystal Breeze St
- 4720 All Points View Way
- 10943 Pendragon Place
- 1911 Falls Landing Dr Unit 103
- 1911 Falls Landing Dr Unit 106
- 2429 Falls River Ave
- 11130 Gwynn Oaks Dr Unit 106
- 2051 Dunn Rd
- 2110 Piney Brook Rd Unit 104
- 2101 Piney Brook Rd Unit 102
- 2111 Piney Brook Rd Unit 101
- 2220 Valley Edge Dr Unit 103
- 2212 Saltree Place
- 2217 Saltree Place
- 10615 Peppermill Dr
- 10619 Peppermill Dr
- 2208 Saltree Place
- 2213 Saltree Place
- 10623 Peppermill Dr
- 10609 Peppermill Dr
- 10605 Peppermill Dr
- 2209 Saltree Place
- 10627 Peppermill Dr
- 2204 Saltree Place
- 10535 Cokesbury Ln
- 10531 Cokesbury Ln
- 10539 Cokesbury Ln
- 10701 Peppermill Dr
- 10527 Cokesbury Ln
- 10510 Neland St
- 10618 Peppermill Dr
- 2200 Saltree Place