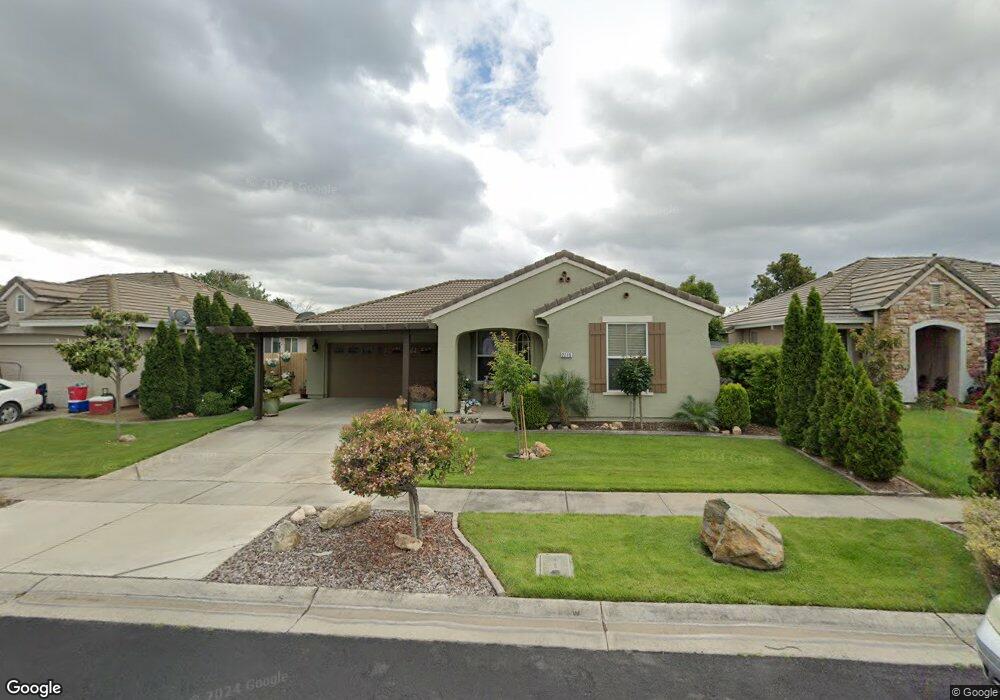
2216 Summerfield Ln Olivehurst, CA 95961
Estimated Value: $311,000 - $402,000
3
Beds
2
Baths
1,424
Sq Ft
$263/Sq Ft
Est. Value
About This Home
This home is located at 2216 Summerfield Ln, Olivehurst, CA 95961 and is currently estimated at $374,210, approximately $262 per square foot. 2216 Summerfield Ln is a home located in Yuba County with nearby schools including Johnson Park Elementary School, Yuba Gardens Intermediate School, and Lindhurst High School.
Ownership History
Date
Name
Owned For
Owner Type
Purchase Details
Closed on
Jul 22, 2021
Sold by
Rosenberg Mary J
Bought by
Rosenberg Mary J
Current Estimated Value
Home Financials for this Owner
Home Financials are based on the most recent Mortgage that was taken out on this home.
Original Mortgage
$153,000
Outstanding Balance
$115,493
Interest Rate
2.23%
Mortgage Type
New Conventional
Estimated Equity
$258,717
Purchase Details
Closed on
Mar 24, 2005
Sold by
Beazer Homes Holdings Corp
Bought by
Rosenberg Mary J
Home Financials for this Owner
Home Financials are based on the most recent Mortgage that was taken out on this home.
Original Mortgage
$222,100
Interest Rate
5.53%
Mortgage Type
Unknown
Purchase Details
Closed on
Mar 7, 2005
Sold by
Rosenberg William Henry
Bought by
Rosenberg Mary J
Home Financials for this Owner
Home Financials are based on the most recent Mortgage that was taken out on this home.
Original Mortgage
$222,100
Interest Rate
5.53%
Mortgage Type
Unknown
Create a Home Valuation Report for This Property
The Home Valuation Report is an in-depth analysis detailing your home's value as well as a comparison with similar homes in the area
Home Values in the Area
Average Home Value in this Area
Purchase History
| Date | Buyer | Sale Price | Title Company |
|---|---|---|---|
| Rosenberg Mary J | -- | First American Title Company | |
| Rosenberg Mary J | $278,000 | First American Title Company | |
| Rosenberg Mary J | -- | First American Title Company |
Source: Public Records
Mortgage History
| Date | Status | Borrower | Loan Amount |
|---|---|---|---|
| Open | Rosenberg Mary J | $153,000 | |
| Closed | Rosenberg Mary J | $222,100 | |
| Closed | Rosenberg Mary J | $41,600 |
Source: Public Records
Tax History Compared to Growth
Tax History
| Year | Tax Paid | Tax Assessment Tax Assessment Total Assessment is a certain percentage of the fair market value that is determined by local assessors to be the total taxable value of land and additions on the property. | Land | Improvement |
|---|---|---|---|---|
| 2025 | $4,636 | $392,237 | $83,626 | $308,611 |
| 2023 | $4,636 | $377,008 | $80,380 | $296,628 |
| 2022 | $4,481 | $369,616 | $78,804 | $290,812 |
| 2021 | $3,714 | $300,000 | $50,000 | $250,000 |
| 2020 | $3,373 | $270,000 | $50,000 | $220,000 |
| 2019 | $3,195 | $255,000 | $40,000 | $215,000 |
| 2018 | $2,891 | $230,000 | $40,000 | $190,000 |
| 2017 | $2,628 | $210,000 | $35,000 | $175,000 |
| 2016 | $2,477 | $195,000 | $30,000 | $165,000 |
| 2015 | $2,456 | $195,000 | $30,000 | $165,000 |
| 2014 | -- | $165,000 | $25,000 | $140,000 |
Source: Public Records
Map
Nearby Homes
- 2256 Mage Ave
- 2202 Mcgowan Pkwy
- 2295 Mcgowan Pkwy Unit 12
- 4317 Twain Dr
- 2094 Virgilia Ln
- 115 Vía Flora
- 4361 Evelyn Dr
- 4294 Lever Ave
- 1925 Beverly Ave
- 1985 16th St
- 802 Berryessa Way
- 798 Berryessa Way
- 794 Berryessa Way
- 1612 Larry St
- 1860 15th St
- 4033 Donald Dr
- 4343 Bluebell Ave
- 4470 College Way
- 4402 Sundari Ave
- 4420 Sundari Ave
- 2222 Summerfield Ln
- 2210 Summerfield Ln Unit 1
- 2210 Summerfield Ln
- 2204 Summerfield Ln
- 2228 Summerfield Ln
- 2215 Summerfield Ln
- 2209 Summerfield Ln
- 2198 Summerfield Ln
- 2203 Summerfield Ln
- 4116 Rose Ave
- 2234 Summerfield Ln
- 2227 Summerfield Ln
- 2197 Summerfield Ln
- 2233 Summerfield Ln
- 2214 August Way
- 2208 August Way
- 2220 August Way
- 2191 Summerfield Ln
- 2202 August Way
- 2226 August Way