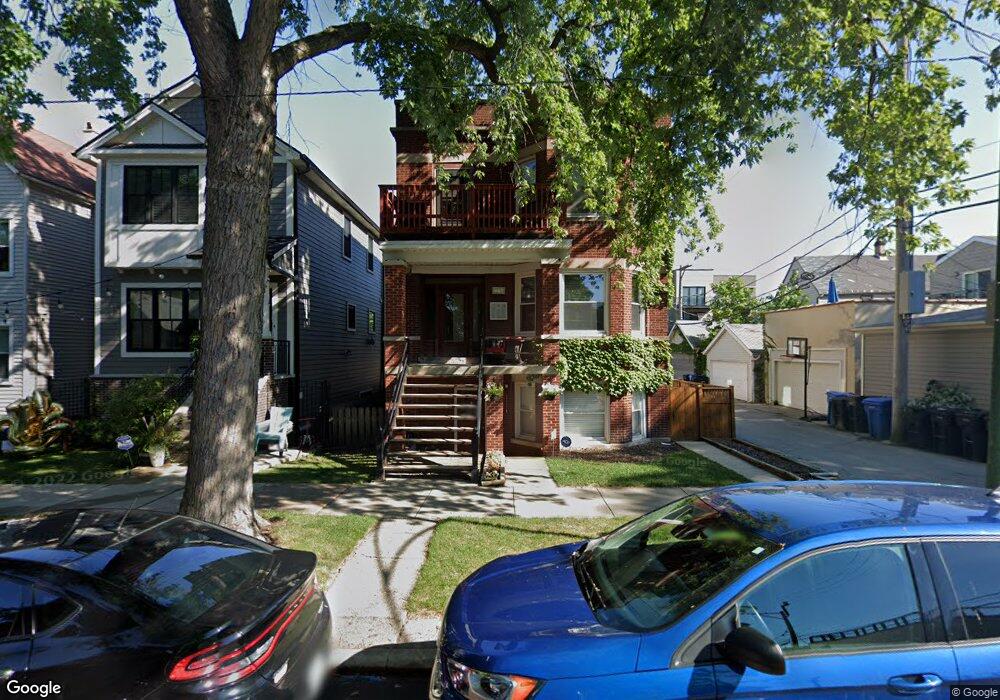
2216 W Fletcher St Unit 3 Chicago, IL 60618
Roscoe Village NeighborhoodEstimated Value: $398,000 - $643,000
2
Beds
1
Bath
1,350
Sq Ft
$367/Sq Ft
Est. Value
About This Home
This home is located at 2216 W Fletcher St Unit 3, Chicago, IL 60618 and is currently estimated at $495,832, approximately $367 per square foot. 2216 W Fletcher St Unit 3 is a home located in Cook County with nearby schools including Jahn School of Fine Arts, Lake View High School, and Saint Luke Academy.
Ownership History
Date
Name
Owned For
Owner Type
Purchase Details
Closed on
Jul 9, 2009
Sold by
Bomely Matthew
Bought by
Fogarty Julie
Current Estimated Value
Home Financials for this Owner
Home Financials are based on the most recent Mortgage that was taken out on this home.
Original Mortgage
$275,600
Outstanding Balance
$182,686
Interest Rate
5.62%
Mortgage Type
Unknown
Estimated Equity
$313,146
Purchase Details
Closed on
May 21, 1999
Sold by
Fletcher Place Llc
Bought by
Bomely Matthew
Home Financials for this Owner
Home Financials are based on the most recent Mortgage that was taken out on this home.
Original Mortgage
$133,500
Interest Rate
7.25%
Purchase Details
Closed on
May 20, 1999
Sold by
Seda Chris A and Seda Deborah P
Bought by
Fletcher Place Llc
Home Financials for this Owner
Home Financials are based on the most recent Mortgage that was taken out on this home.
Original Mortgage
$133,500
Interest Rate
7.25%
Create a Home Valuation Report for This Property
The Home Valuation Report is an in-depth analysis detailing your home's value as well as a comparison with similar homes in the area
Home Values in the Area
Average Home Value in this Area
Purchase History
| Date | Buyer | Sale Price | Title Company |
|---|---|---|---|
| Fogarty Julie | $306,500 | Attorneys Title Guaranty Fun | |
| Bomely Matthew | $233,500 | Mercury Title Company | |
| Fletcher Place Llc | -- | Chicago Title Insurance Co |
Source: Public Records
Mortgage History
| Date | Status | Borrower | Loan Amount |
|---|---|---|---|
| Open | Fogarty Julie | $275,600 | |
| Previous Owner | Bomely Matthew | $133,500 |
Source: Public Records
Tax History Compared to Growth
Tax History
| Year | Tax Paid | Tax Assessment Tax Assessment Total Assessment is a certain percentage of the fair market value that is determined by local assessors to be the total taxable value of land and additions on the property. | Land | Improvement |
|---|---|---|---|---|
| 2024 | $6,474 | $40,775 | $21,840 | $18,935 |
| 2023 | $6,290 | $34,000 | $9,659 | $24,341 |
| 2022 | $6,290 | $34,000 | $9,659 | $24,341 |
| 2021 | $6,167 | $33,999 | $9,659 | $24,340 |
| 2020 | $7,555 | $37,018 | $8,453 | $28,565 |
| 2019 | $7,511 | $40,814 | $8,453 | $32,361 |
| 2018 | $10,158 | $54,859 | $8,453 | $46,406 |
| 2017 | $6,296 | $32,624 | $7,396 | $25,228 |
| 2016 | $6,034 | $32,624 | $7,396 | $25,228 |
| 2015 | $5,498 | $32,624 | $7,396 | $25,228 |
| 2014 | $5,651 | $33,025 | $5,679 | $27,346 |
| 2013 | $5,528 | $33,025 | $5,679 | $27,346 |
Source: Public Records
Map
Nearby Homes
- 3140 N Leavitt St
- 2209 W Belmont Ave Unit 3
- 2239 W Belmont Ave Unit 2
- 2222 W Belmont Ave Unit 504
- 2249 W Belmont Ave
- 2149 W Belmont Ave Unit 3W
- 2141 W Belmont Ave Unit 3
- 3107 N Oakley Ave
- 2140 W Belmont Ave Unit 1
- 2130 W Belmont Ave Unit 3A
- 3100 N Clybourn Ave
- 3052 N Oakley Ave Unit 3
- 3052 N Oakley Ave Unit 1
- 3237 N Oakley Ave Unit 2N
- 3137 N Hoyne Ave
- 3040 N Hoyne Ave
- 3306 N Bell Ave
- 2043 W Belmont Ave Unit 3
- 3131 N Western Ave Unit 2
- 3015 N Hamilton Ave
- 2216 W Fletcher St Unit 1
- 2216 W Fletcher St Unit 2
- 2218 W Fletcher St Unit 2
- 2218 W Fletcher St
- 2220 W Fletcher St
- 2224 W Fletcher St Unit 3
- 3136 N Leavitt St
- 3138 N Leavitt St
- 3142 N Leavitt St
- 2226 W Fletcher St
- 3134 N Leavitt St Unit 2
- 3134 N Leavitt St Unit 1R
- 3144 N Leavitt St
- 3144 N Leavitt St Unit GARDEN
- 2228 W Fletcher St
- 2219 W Fletcher St
- 2230 W Fletcher St
- 2219 W Belmont Ave Unit 304
- 2219 W Belmont Ave Unit 1E
- 2219 W Belmont Ave Unit 101