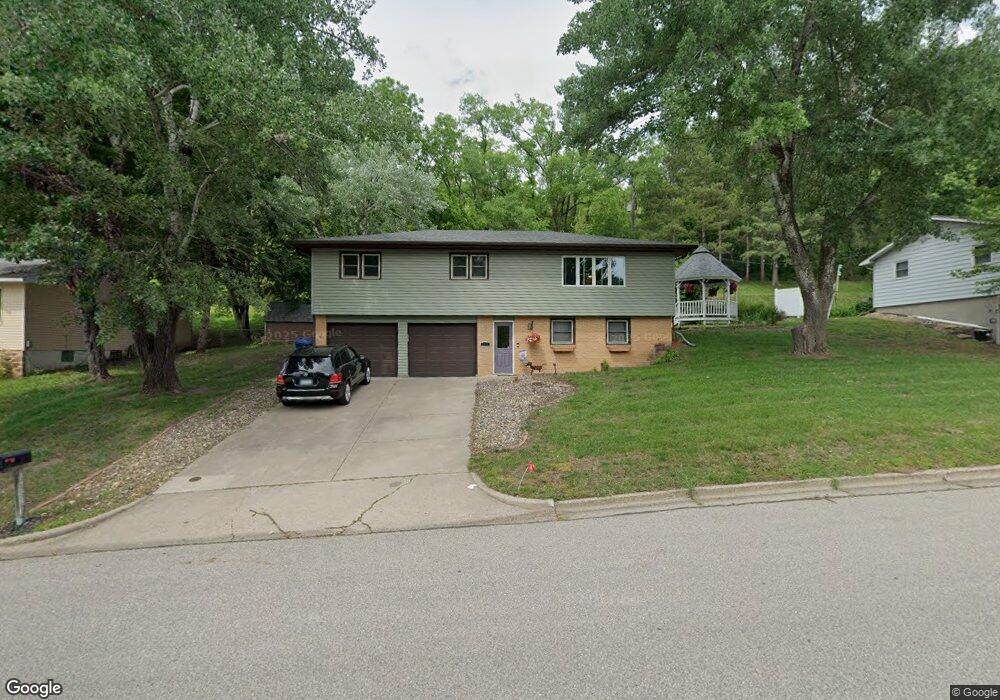
2217 Bush St Red Wing, MN 55066
Estimated Value: $286,000 - $324,778
3
Beds
2
Baths
2,020
Sq Ft
$149/Sq Ft
Est. Value
About This Home
This home is located at 2217 Bush St, Red Wing, MN 55066 and is currently estimated at $301,195, approximately $149 per square foot. 2217 Bush St is a home located in Goodhue County with nearby schools including Sunnyside Elementary School, Burnside Elementary School, and Twin Bluff Middle School.
Ownership History
Date
Name
Owned For
Owner Type
Purchase Details
Closed on
Jun 28, 2021
Sold by
Hartleip Raymond Lesterr and Hartleip Cindy Lou
Bought by
Bolland Frederick G and Stein Melanie
Current Estimated Value
Home Financials for this Owner
Home Financials are based on the most recent Mortgage that was taken out on this home.
Original Mortgage
$247,200
Outstanding Balance
$224,296
Interest Rate
2.9%
Mortgage Type
New Conventional
Estimated Equity
$76,899
Purchase Details
Closed on
Feb 5, 2018
Sold by
Bell Katie M
Bought by
Hartleip Raymond L and Hartleip Cindy H
Purchase Details
Closed on
Jan 31, 2017
Sold by
Gosse Ryan Keith
Bought by
Bell Katie Marie and Gosse Katie Bell
Purchase Details
Closed on
Sep 30, 2011
Sold by
Stolpa Walter M A and Stolpa Betty A
Bought by
Gosse Ryan K and Gosse Katie B
Create a Home Valuation Report for This Property
The Home Valuation Report is an in-depth analysis detailing your home's value as well as a comparison with similar homes in the area
Home Values in the Area
Average Home Value in this Area
Purchase History
| Date | Buyer | Sale Price | Title Company |
|---|---|---|---|
| Bolland Frederick G | $309,000 | Heritage Title | |
| Hartleip Raymond L | $1,000 | -- | |
| Bell Katie Marie | -- | None Available | |
| Gosse Ryan K | $143,500 | -- | |
| Bolland Frederick Frederick | $309,000 | -- |
Source: Public Records
Mortgage History
| Date | Status | Borrower | Loan Amount |
|---|---|---|---|
| Open | Bolland Frederick G | $247,200 | |
| Closed | Bolland Frederick Frederick | $247,200 |
Source: Public Records
Tax History Compared to Growth
Tax History
| Year | Tax Paid | Tax Assessment Tax Assessment Total Assessment is a certain percentage of the fair market value that is determined by local assessors to be the total taxable value of land and additions on the property. | Land | Improvement |
|---|---|---|---|---|
| 2025 | $3,438 | $277,300 | $54,400 | $222,900 |
| 2024 | $3,438 | $272,900 | $54,400 | $218,500 |
| 2023 | $1,713 | $256,900 | $54,300 | $202,600 |
| 2022 | $3,062 | $255,300 | $54,300 | $201,000 |
| 2021 | $2,826 | $219,600 | $54,300 | $165,300 |
| 2020 | $2,670 | $206,900 | $54,300 | $152,600 |
| 2019 | $2,490 | $185,500 | $54,300 | $131,200 |
| 2018 | $2,012 | $176,700 | $52,300 | $124,400 |
| 2017 | $1,968 | $156,800 | $52,300 | $104,500 |
| 2016 | $1,806 | $155,500 | $52,300 | $103,200 |
| 2015 | $1,738 | $150,700 | $52,300 | $98,400 |
| 2014 | -- | $145,200 | $52,300 | $92,900 |
Source: Public Records
Map
Nearby Homes