2217 Gerbert Rd Unit 221 Columbus, OH 43211
South Linden NeighborhoodEstimated Value: $203,000 - $263,000
6
Beds
3
Baths
2,400
Sq Ft
$97/Sq Ft
Est. Value
About This Home
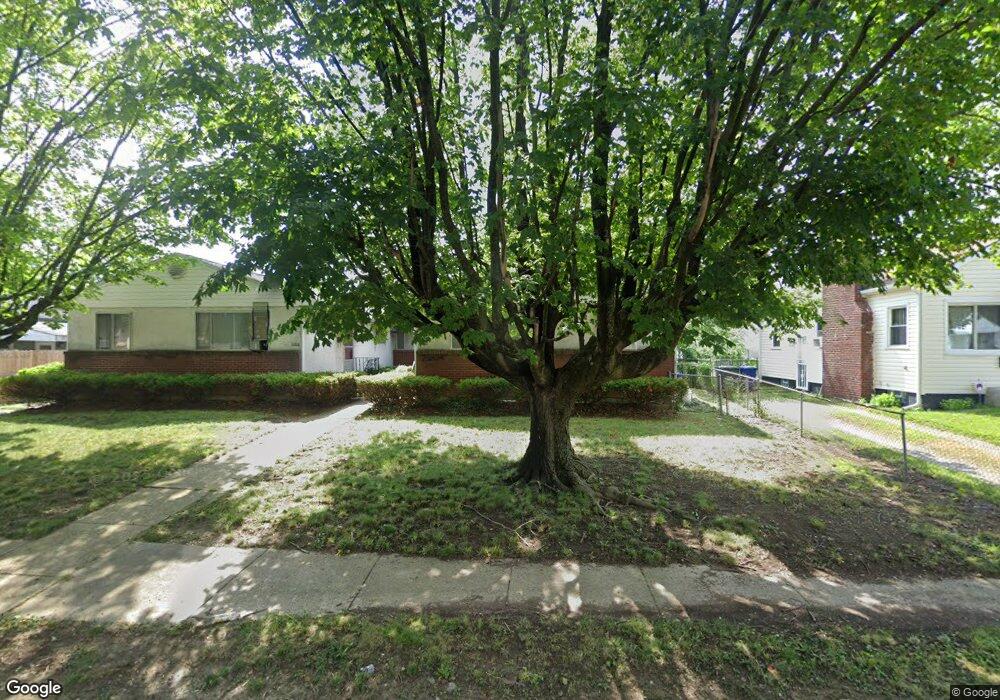
This home is located at 2217 Gerbert Rd Unit 221, Columbus, OH 43211 and is currently estimated at $232,333, approximately $96 per square foot. 2217 Gerbert Rd Unit 221 is a home located in Franklin County with nearby schools including Linden-Mckinley Stem School On Arcadia, North Columbus Preparatory Academy, and Midnimo Cross Cultural Middle School.
Ownership History
Date
Name
Owned For
Owner Type
Purchase Details
Closed on
Oct 14, 2022
Sold by
County Treasurer
Bought by
Nar Ohio Llc
Current Estimated Value
Purchase Details
Closed on
Jul 28, 2022
Sold by
Jones Iii Rufus H
Bought by
Jones Rustin I
Purchase Details
Closed on
Jan 31, 2013
Sold by
Cockran Patricia and Cockran Patricia
Bought by
Jones Rufus H
Purchase Details
Closed on
Jul 7, 2008
Sold by
Harshaw Sheila R
Bought by
Jones Elizabeth M
Purchase Details
Closed on
Feb 8, 2008
Sold by
Jackson Odessa L
Bought by
Harshaw Sheila R
Purchase Details
Closed on
Dec 19, 2007
Sold by
Jones Elizabeth Maude and Jones Rufus H
Bought by
Jackson Odessa L
Purchase Details
Closed on
Jul 9, 1990
Purchase Details
Closed on
Aug 9, 1988
Create a Home Valuation Report for This Property
The Home Valuation Report is an in-depth analysis detailing your home's value as well as a comparison with similar homes in the area
Home Values in the Area
Average Home Value in this Area
Purchase History
| Date | Buyer | Sale Price | Title Company |
|---|---|---|---|
| Nar Ohio Llc | -- | -- | |
| Jones Rustin I | -- | Renny J Tyson Co Lpa | |
| Jones Rufus H | $42,200 | None Available | |
| Jones Rufus H | $41,200 | None Available | |
| Jones Elizabeth M | $130,000 | None Available | |
| Harshaw Sheila R | -- | Attorney | |
| Jackson Odessa L | -- | Attorney | |
| -- | $90,000 | -- | |
| -- | -- | -- |
Source: Public Records
Tax History Compared to Growth
Tax History
| Year | Tax Paid | Tax Assessment Tax Assessment Total Assessment is a certain percentage of the fair market value that is determined by local assessors to be the total taxable value of land and additions on the property. | Land | Improvement |
|---|---|---|---|---|
| 2024 | $6,067 | $62,520 | $6,760 | $55,760 |
| 2023 | $2,960 | $62,510 | $6,755 | $55,755 |
| 2022 | $4,714 | $25,770 | $5,290 | $20,480 |
| 2021 | $1,686 | $25,770 | $5,290 | $20,480 |
| 2020 | $1,513 | $25,770 | $5,290 | $20,480 |
| 2019 | $1,474 | $21,460 | $4,380 | $17,080 |
| 2018 | $1,355 | $21,460 | $4,380 | $17,080 |
| 2017 | $1,580 | $21,460 | $4,380 | $17,080 |
| 2016 | $1,815 | $25,770 | $3,820 | $21,950 |
| 2015 | $1,468 | $23,950 | $2,000 | $21,950 |
| 2014 | $1,471 | $23,950 | $2,000 | $21,950 |
| 2013 | $806 | $26,600 | $2,205 | $24,395 |
Source: Public Records
Map
Nearby Homes
- 2210 Gerbert Rd
- 2234 Hamilton Ave
- 2275 Ontario St
- 2166 Lexington Ave
- 2243-2245 Lexington Ave
- 2315 Gerbert Rd
- 2225 Medina Ave
- 2173 Lexington Ave
- 2214 Medina Ave
- 1250 E Hudson St
- 1213 Loretta Ave
- 1310 E Hudson St
- 1084 E Hudson St
- 2214 Grasmere Ave
- 968 Duxberry Ave
- 1400 E Maynard Ave
- 1215 E 24th Ave
- 1335 E 25th Ave Unit 337
- 2453 McGuffey Rd
- 1457 Cordell Ave
- 2221 Gerbert Rd
- 2227 Gerbert Rd
- 2233 Gerbert Rd
- 2211 Gerbert Rd
- 2237 Gerbert Rd
- 2205 Gerbert Rd
- 2222 Gerbert Rd
- 2228 Hamilton Ave
- 2228 Gerbert Rd
- 2216 Gerbert Rd
- 2224 Hamilton Ave
- 2243 Gerbert Rd
- 2201 Gerbert Rd
- 2240 Hamilton Ave
- 2232 Gerbert Rd
- 2218 Hamilton Ave
- 2238 Gerbert Rd
- 2206 Gerbert Rd
- 2208 Hamilton Ave
- 2249 Gerbert Rd