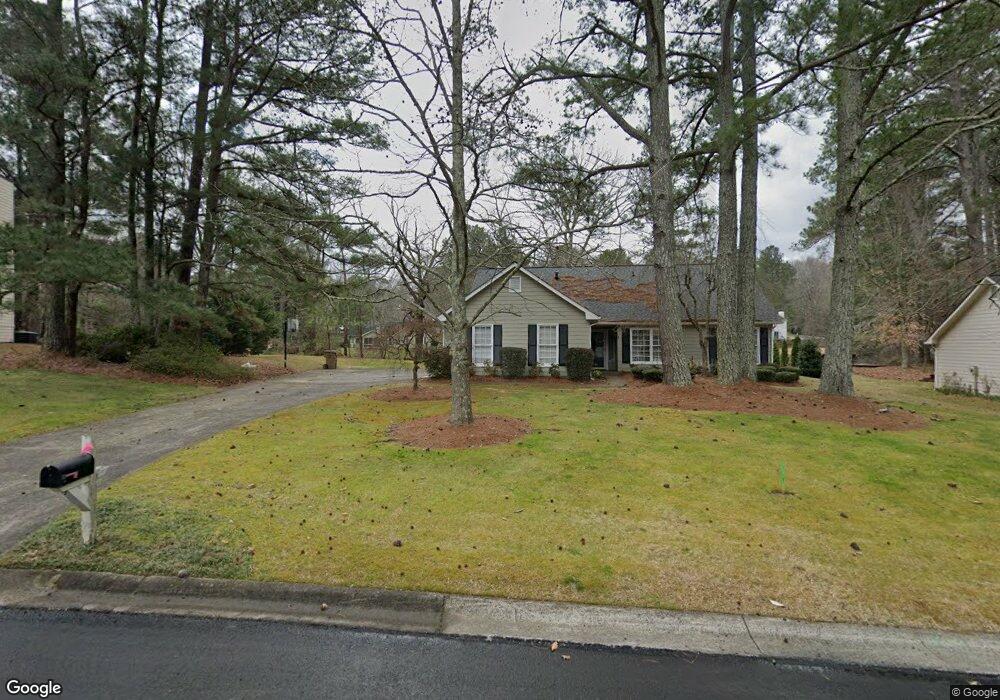
2217 Heritage Trace View Unit 3 Marietta, GA 30062
East Cobb NeighborhoodEstimated Value: $512,390 - $558,000
3
Beds
2
Baths
1,507
Sq Ft
$358/Sq Ft
Est. Value
About This Home
This home is located at 2217 Heritage Trace View Unit 3, Marietta, GA 30062 and is currently estimated at $539,348, approximately $357 per square foot. 2217 Heritage Trace View Unit 3 is a home located in Cobb County with nearby schools including Timber Ridge Elementary School, Dodgen Middle School, and Walton High School.
Ownership History
Date
Name
Owned For
Owner Type
Purchase Details
Closed on
Oct 26, 2004
Sold by
Chorn John W and Chorn Judy
Bought by
Ryley William S
Current Estimated Value
Home Financials for this Owner
Home Financials are based on the most recent Mortgage that was taken out on this home.
Original Mortgage
$169,350
Outstanding Balance
$83,871
Interest Rate
5.77%
Mortgage Type
New Conventional
Estimated Equity
$455,477
Purchase Details
Closed on
Jun 30, 1998
Sold by
Waggoner Bradley K and Waggoner Lisa L
Bought by
Chorn John W and Chorn Judy L
Home Financials for this Owner
Home Financials are based on the most recent Mortgage that was taken out on this home.
Original Mortgage
$108,200
Interest Rate
7.1%
Mortgage Type
New Conventional
Create a Home Valuation Report for This Property
The Home Valuation Report is an in-depth analysis detailing your home's value as well as a comparison with similar homes in the area
Home Values in the Area
Average Home Value in this Area
Purchase History
| Date | Buyer | Sale Price | Title Company |
|---|---|---|---|
| Ryley William S | $216,000 | -- | |
| Chorn John W | $148,000 | -- |
Source: Public Records
Mortgage History
| Date | Status | Borrower | Loan Amount |
|---|---|---|---|
| Open | Ryley William S | $169,350 | |
| Previous Owner | Chorn John W | $108,200 |
Source: Public Records
Tax History Compared to Growth
Tax History
| Year | Tax Paid | Tax Assessment Tax Assessment Total Assessment is a certain percentage of the fair market value that is determined by local assessors to be the total taxable value of land and additions on the property. | Land | Improvement |
|---|---|---|---|---|
| 2025 | $5,182 | $172,000 | $50,000 | $122,000 |
| 2024 | $5,186 | $172,000 | $50,000 | $122,000 |
| 2023 | $5,403 | $179,192 | $50,000 | $129,192 |
| 2022 | $4,243 | $139,816 | $50,000 | $89,816 |
| 2021 | $3,813 | $125,628 | $46,800 | $78,828 |
| 2020 | $3,813 | $125,628 | $46,800 | $78,828 |
| 2019 | $3,606 | $118,800 | $46,800 | $72,000 |
| 2018 | $3,606 | $118,800 | $46,800 | $72,000 |
| 2017 | $2,916 | $101,432 | $44,400 | $57,032 |
| 2016 | $2,792 | $97,128 | $46,000 | $51,128 |
| 2015 | $2,260 | $76,720 | $27,200 | $49,520 |
| 2014 | $2,279 | $76,720 | $0 | $0 |
Source: Public Records
Map
Nearby Homes
- 2212 Heritage Trace View
- 1929 Fields Pond Glen
- 1961 Fields Pond Dr
- 2743 Chimney Springs Dr
- 4789 Waterhaven Bend
- 4780 Waterhaven Bend
- 2281 Fox Hound Pkwy
- 4586 Hunting Hound Ln
- 2066 Old Forge Way
- 2255 Rushmore Dr
- 2100 Stone Hollow Ct
- 2482 N Forest Dr
- 5108 Nicolet Ct
- 2661 Sandpoint Way NE
- 2655 Boulder Creek Dr NE
- 1804 Shelburne Ridge
- 2219 Heritage Trace View
- 2215 Heritage Trace View
- 2156 Heritage Trace Dr
- 2221 Heritage Trace View
- 2224 Heritage Trace View
- 2213 Heritage Trace View
- 4957 Woodlake View Unit 1
- 2160 Heritage Trace Dr Unit I
- 2222 Heritage Trace View Unit 2222
- 2222 Heritage Trace View
- 2260 Woodlake Trace
- 2164 Heritage Trace Dr
- 4961 Woodlake View
- 2211 Heritage Trace View
- 2220 Heritage Trace View
- 2223 Heritage Trace View
- 2225 Heritage Trace View
- 2261 Woodlake Trace
- 2218 Heritage Trace View
- 2155 Heritage Trace Dr