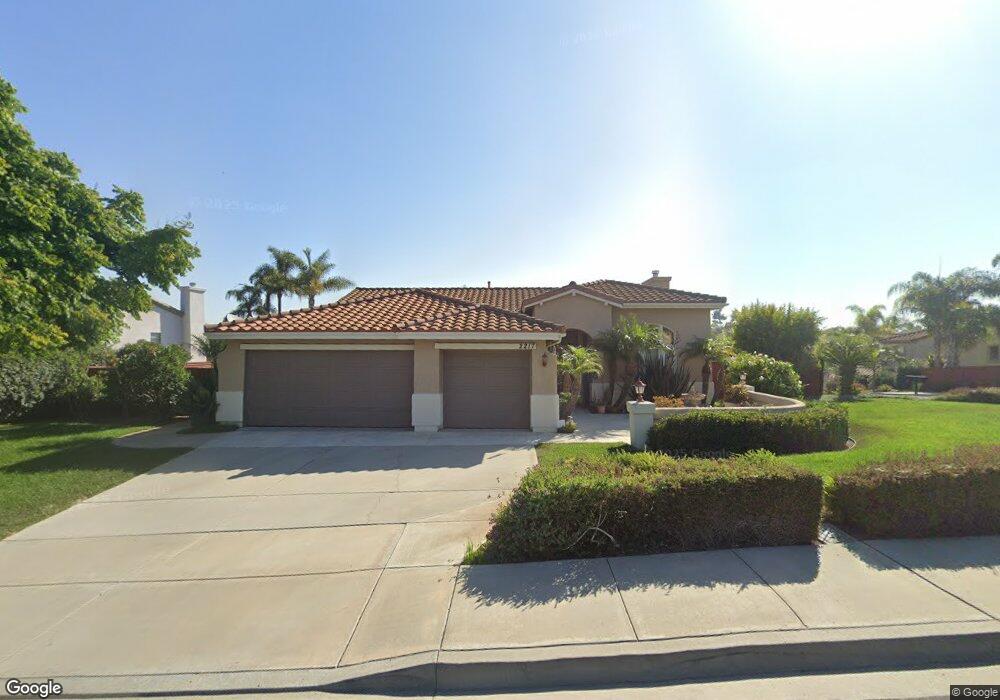
2217 Longfellow Rd Carlsbad, CA 92008
Kelly Ranch NeighborhoodEstimated Value: $1,452,682 - $1,819,000
4
Beds
2
Baths
1,908
Sq Ft
$861/Sq Ft
Est. Value
About This Home
This home is located at 2217 Longfellow Rd, Carlsbad, CA 92008 and is currently estimated at $1,643,671, approximately $861 per square foot. 2217 Longfellow Rd is a home located in San Diego County with nearby schools including Kelly Elementary School, Sage Creek High, and Carlsbad High School.
Ownership History
Date
Name
Owned For
Owner Type
Purchase Details
Closed on
Jul 8, 2013
Sold by
Babineau Steven R and Babineau Denise M
Bought by
Babineau Steven R and Babineau Denise M
Current Estimated Value
Home Financials for this Owner
Home Financials are based on the most recent Mortgage that was taken out on this home.
Original Mortgage
$165,500
Outstanding Balance
$119,679
Interest Rate
3.79%
Mortgage Type
VA
Estimated Equity
$1,523,992
Purchase Details
Closed on
Jan 28, 2003
Sold by
Babineau Steven R and Babineau Denise M
Bought by
Babineau Steven R and Babineau Denise M
Purchase Details
Closed on
Jul 9, 1996
Sold by
Shea Homes Ltd Partnership
Bought by
Babineau Steven R and Babineau Denise M
Home Financials for this Owner
Home Financials are based on the most recent Mortgage that was taken out on this home.
Original Mortgage
$185,000
Interest Rate
8.3%
Mortgage Type
Balloon
Create a Home Valuation Report for This Property
The Home Valuation Report is an in-depth analysis detailing your home's value as well as a comparison with similar homes in the area
Home Values in the Area
Average Home Value in this Area
Purchase History
| Date | Buyer | Sale Price | Title Company |
|---|---|---|---|
| Babineau Steven R | -- | Accommodation | |
| Babineau Steven R | -- | Chicago Title Company | |
| Babineau Steven R | -- | -- | |
| Babineau Steven R | $277,500 | Continental Lawyers Title |
Source: Public Records
Mortgage History
| Date | Status | Borrower | Loan Amount |
|---|---|---|---|
| Open | Babineau Steven R | $165,500 | |
| Closed | Babineau Steven R | $185,000 |
Source: Public Records
Tax History
| Year | Tax Paid | Tax Assessment Tax Assessment Total Assessment is a certain percentage of the fair market value that is determined by local assessors to be the total taxable value of land and additions on the property. | Land | Improvement |
|---|---|---|---|---|
| 2025 | $4,699 | $451,648 | $162,856 | $288,792 |
| 2024 | $4,699 | $442,793 | $159,663 | $283,130 |
| 2023 | $4,673 | $434,112 | $156,533 | $277,579 |
| 2022 | $4,600 | $425,601 | $153,464 | $272,137 |
| 2021 | $4,564 | $417,256 | $150,455 | $266,801 |
| 2020 | $4,533 | $412,979 | $148,913 | $264,066 |
| 2019 | $4,450 | $404,883 | $145,994 | $258,889 |
| 2018 | $4,262 | $396,945 | $143,132 | $253,813 |
| 2017 | $92 | $389,163 | $140,326 | $248,837 |
| 2016 | $4,020 | $381,533 | $137,575 | $243,958 |
| 2015 | $4,003 | $375,803 | $135,509 | $240,294 |
| 2014 | $3,936 | $368,442 | $132,855 | $235,587 |
Source: Public Records
Map
Nearby Homes
- 5128 Don Mata Dr
- 5115 Don Miguel Dr Unit 165
- 3438 Don Ortega Dr
- 3430 Don Cota Dr Unit 233
- 3466 Don Lorenzo Dr Unit 324
- 5114 Don Miguel Dr Unit 152
- 3462 Don Ortega Dr
- 5140 Don Rodolfo Dr Unit 178
- 5459 Don Felipe Dr Unit 485
- 5229 Don Valdez Dr
- 5307 Don Ricardo Dr Unit 68
- 3446 Don Cota Dr Unit 235
- 3438 Don Alberto Dr Unit 434
- 2289 Bryant Dr
- 5077 Ashberry Rd
- 5146 Delaney Ct
- 5423 Foxtail Loop
- 2336 Summerwind Place
- 3505 N Fork Ave
- 5512 Foxtail Loop
- 2213 Longfellow Rd
- 2414 Byron Place
- 2411 Byron Place
- 2330 Byron Place
- 2209 Longfellow Rd
- 2418 Byron Place
- 2422 Byron Place
- 2415 Byron Place
- 2341 Masters Rd
- 5221 Frost Ave
- 2326 Byron Place
- 5225 Frost Ave
- 2205 Longfellow Rd
- 2337 Masters Rd
- 5229 Frost Ave
- 2419 Byron Place
- 2426 Byron Place
- 2322 Byron Place
- 2333 Masters Rd
- 5233 Frost Ave
Your Personal Tour Guide
Ask me questions while you tour the home.