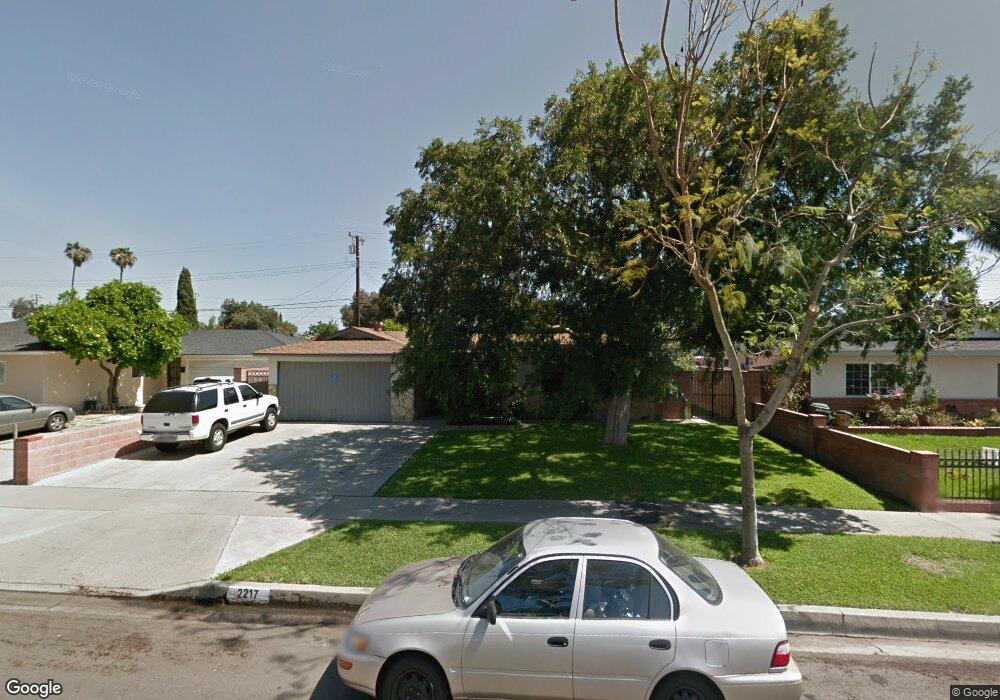
2217 S Everglade St Santa Ana, CA 92704
Centennial Park NeighborhoodEstimated Value: $816,000 - $892,000
3
Beds
2
Baths
1,212
Sq Ft
$697/Sq Ft
Est. Value
About This Home
This home is located at 2217 S Everglade St, Santa Ana, CA 92704 and is currently estimated at $844,246, approximately $696 per square foot. 2217 S Everglade St is a home located in Orange County with nearby schools including Adams Elementary School, Gerald P. Carr Intermediate School, and Valley High School.
Ownership History
Date
Name
Owned For
Owner Type
Purchase Details
Closed on
Apr 6, 2013
Sold by
Alvarez Juan
Bought by
Alvarez Juan and Alvarez Maria
Current Estimated Value
Purchase Details
Closed on
May 24, 2000
Sold by
Michael Martin and Michael Karen
Bought by
Alvarez Juan
Home Financials for this Owner
Home Financials are based on the most recent Mortgage that was taken out on this home.
Original Mortgage
$153,221
Interest Rate
8.55%
Mortgage Type
FHA
Purchase Details
Closed on
Jan 20, 1995
Sold by
Greenberg Karen B
Bought by
Greenberg Karen and Trust Of Karen Greenberg
Purchase Details
Closed on
Jan 26, 1994
Sold by
Martin Michael and Greenberg Karen
Bought by
Martin Michael K and Greenberg Karen B
Purchase Details
Closed on
Mar 5, 1993
Sold by
Greenberg Karen and Martin Michael
Bought by
Greenberg Karen and Martin Michael
Create a Home Valuation Report for This Property
The Home Valuation Report is an in-depth analysis detailing your home's value as well as a comparison with similar homes in the area
Home Values in the Area
Average Home Value in this Area
Purchase History
| Date | Buyer | Sale Price | Title Company |
|---|---|---|---|
| Alvarez Juan | -- | None Available | |
| Alvarez Juan | $185,000 | North American Title Co | |
| Greenberg Karen | -- | -- | |
| Martin Michael K | -- | -- | |
| Greenberg Karen | -- | -- |
Source: Public Records
Mortgage History
| Date | Status | Borrower | Loan Amount |
|---|---|---|---|
| Previous Owner | Alvarez Juan | $153,221 | |
| Closed | Alvarez Juan | $5,550 |
Source: Public Records
Tax History Compared to Growth
Tax History
| Year | Tax Paid | Tax Assessment Tax Assessment Total Assessment is a certain percentage of the fair market value that is determined by local assessors to be the total taxable value of land and additions on the property. | Land | Improvement |
|---|---|---|---|---|
| 2025 | $3,353 | $278,753 | $214,423 | $64,330 |
| 2024 | $3,353 | $273,288 | $210,219 | $63,069 |
| 2023 | $3,267 | $267,930 | $206,097 | $61,833 |
| 2022 | $3,229 | $262,677 | $202,056 | $60,621 |
| 2021 | $3,154 | $257,527 | $198,094 | $59,433 |
| 2020 | $3,158 | $254,887 | $196,063 | $58,824 |
| 2019 | $3,097 | $249,890 | $192,219 | $57,671 |
| 2018 | $2,981 | $244,991 | $188,450 | $56,541 |
| 2017 | $2,954 | $240,188 | $184,755 | $55,433 |
| 2016 | $2,895 | $235,479 | $181,132 | $54,347 |
| 2015 | $2,857 | $231,942 | $178,411 | $53,531 |
| 2014 | $2,806 | $227,399 | $174,916 | $52,483 |
Source: Public Records
Map
Nearby Homes
- 2322 S Greenville St
- 2424 S Laurelwood Unit 143
- 2970 C S Greenville St
- 2309 W Anahurst Place
- 2849 S Fairview St Unit H
- 2718 S Griset Place
- 2029 W Flora St
- 2513 W Occidental St
- 2108 S Artesia St
- 3510 & 3512 W Pine St
- 2730 W Segerstrom Ave Unit D
- 2813 S Fairview St Unit G
- 2875 S Fairview St
- 2521 W Stanford St
- 1838 S Artesia St
- 3101 S Fairview St Unit 70
- 3101 S Fairview St Unit Spc 192
- 2500 S Salta St Unit 43
- 2926 W La Verne Ave
- 2318 W Moore Ave
- 2213 S Everglade St
- 2221 S Everglade St
- 2222 S Glenarbor St
- 2226 S Glenarbor St
- 2209 S Everglade St
- 2225 S Everglade St
- 2218 S Glenarbor St
- 2230 S Glenarbor St
- 2702 W Maywood Ave
- 2701 W Pendleton Ave
- 2214 S Glenarbor St
- 2205 S Everglade St
- 2229 S Everglade St
- 2234 S Glenarbor St
- 2706 W Maywood Ave
- 2210 S Glenarbor St
- 2705 W Pendleton Ave
- 2201 S Everglade St
- 2302 S Glenarbor St
- 2629 W Maywood Ave