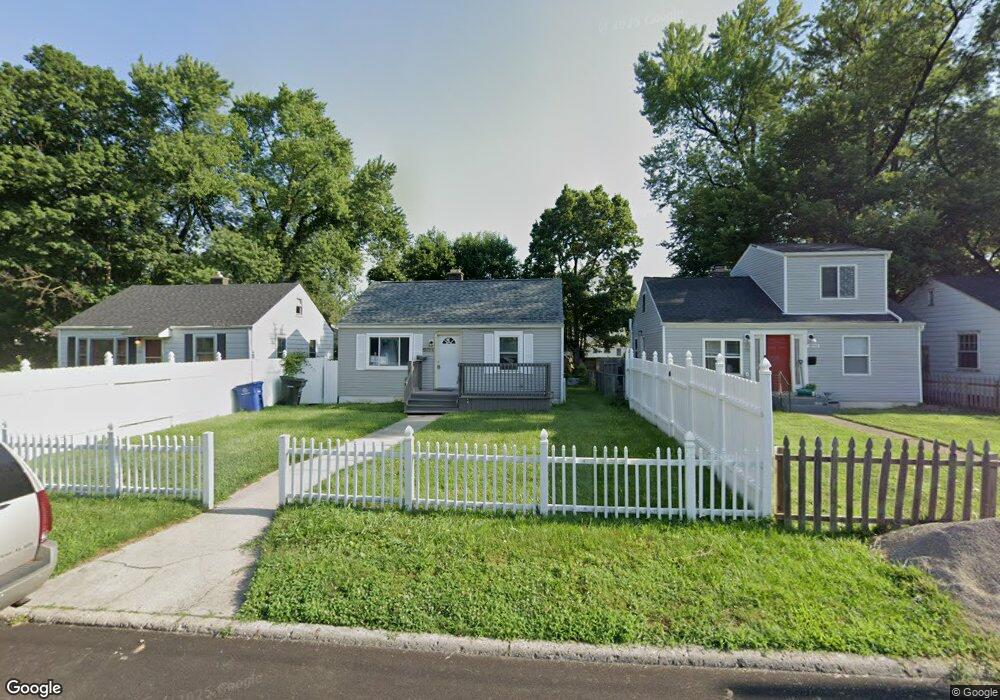
2218 Avalon Place Columbus, OH 43219
Shepard NeighborhoodEstimated Value: $124,000 - $151,000
2
Beds
1
Bath
1,081
Sq Ft
$129/Sq Ft
Est. Value
About This Home
This home is located at 2218 Avalon Place, Columbus, OH 43219 and is currently estimated at $139,379, approximately $128 per square foot. 2218 Avalon Place is a home located in Franklin County with nearby schools including East Columbus Elementary School, Champion Middle School, and East High School.
Ownership History
Date
Name
Owned For
Owner Type
Purchase Details
Closed on
Dec 24, 2012
Sold by
Hopkins William G and Hopkins William
Bought by
Hopkins Properties Llc
Current Estimated Value
Purchase Details
Closed on
Jan 8, 2009
Sold by
Hsbc Mortgage Services Inc
Bought by
Hopkins William G
Purchase Details
Closed on
Dec 29, 2008
Sold by
Gilbert Glenda A and Case #07Cve12 17256
Bought by
Hsbc Mortgage Services Inc
Purchase Details
Closed on
Sep 12, 2005
Sold by
Estate Of James L Gilbert
Bought by
Gilbert Glenda A
Purchase Details
Closed on
Apr 28, 1969
Bought by
Gilbert James L
Create a Home Valuation Report for This Property
The Home Valuation Report is an in-depth analysis detailing your home's value as well as a comparison with similar homes in the area
Home Values in the Area
Average Home Value in this Area
Purchase History
| Date | Buyer | Sale Price | Title Company |
|---|---|---|---|
| Hopkins Properties Llc | -- | None Available | |
| Hopkins William G | $11,000 | Attorney | |
| Hsbc Mortgage Services Inc | $50,000 | None Available | |
| Gilbert Glenda A | -- | -- | |
| Gilbert James L | -- | -- |
Source: Public Records
Tax History Compared to Growth
Tax History
| Year | Tax Paid | Tax Assessment Tax Assessment Total Assessment is a certain percentage of the fair market value that is determined by local assessors to be the total taxable value of land and additions on the property. | Land | Improvement |
|---|---|---|---|---|
| 2024 | $2,002 | $43,680 | $7,070 | $36,610 |
| 2023 | $1,977 | $43,680 | $7,070 | $36,610 |
| 2022 | $663 | $12,470 | $2,700 | $9,770 |
| 2021 | $664 | $12,470 | $2,700 | $9,770 |
| 2020 | $665 | $12,470 | $2,700 | $9,770 |
| 2019 | $675 | $10,860 | $2,350 | $8,510 |
| 2018 | $354 | $10,860 | $2,350 | $8,510 |
| 2017 | $750 | $14,570 | $2,350 | $12,220 |
| 2016 | $594 | $8,750 | $2,450 | $6,300 |
| 2015 | $541 | $8,750 | $2,450 | $6,300 |
| 2014 | $543 | $8,750 | $2,450 | $6,300 |
| 2013 | $422 | $13,790 | $2,730 | $11,060 |
Source: Public Records
Map
Nearby Homes
- 2287 Margaret Ave Unit 289
- 797 N Nelson Rd
- 2122 Margaret Ave
- 440 N Nelson Rd
- 2278 Ridgeway Ave Unit 278
- 2268 Ridgeway Ave
- 1961 Dartmouth Ave
- 2040 E 5th Ave
- 0 Wellington Blvd
- 2143 Leonard Ave
- 2421 Airport Dr
- 291 N Drexel Ave
- 691-693 N Dawson Ave
- 1065 Sunbury Rd
- 782 Northview Ave
- 796 Northview Ave
- 189 N Parkview Ave
- 2288 Woodward Ave
- 2695 Bellwood Ave
- 2742 E 5th Ave
- 2222 Avalon Place
- 2222 Avalon Place Unit 2222 Avalon Place
- 2212 Avalon Place
- 2228 Avalon Place
- 2208 Avalon Place
- 2232 Avalon Place
- 2202 Avalon Place
- 2196 Avalon Place
- 2225 Dartmouth Ave
- 2238 Avalon Place
- 2231 Dartmouth Ave
- 2219 Dartmouth Ave
- 2213 Dartmouth Ave
- 2235 Dartmouth Ave
- 2190 Avalon Place
- 2241 Dartmouth Ave
- 2209 Dartmouth Ave
- 2245 Dartmouth Ave
- 2203 Dartmouth Ave
- 2186 Avalon Place