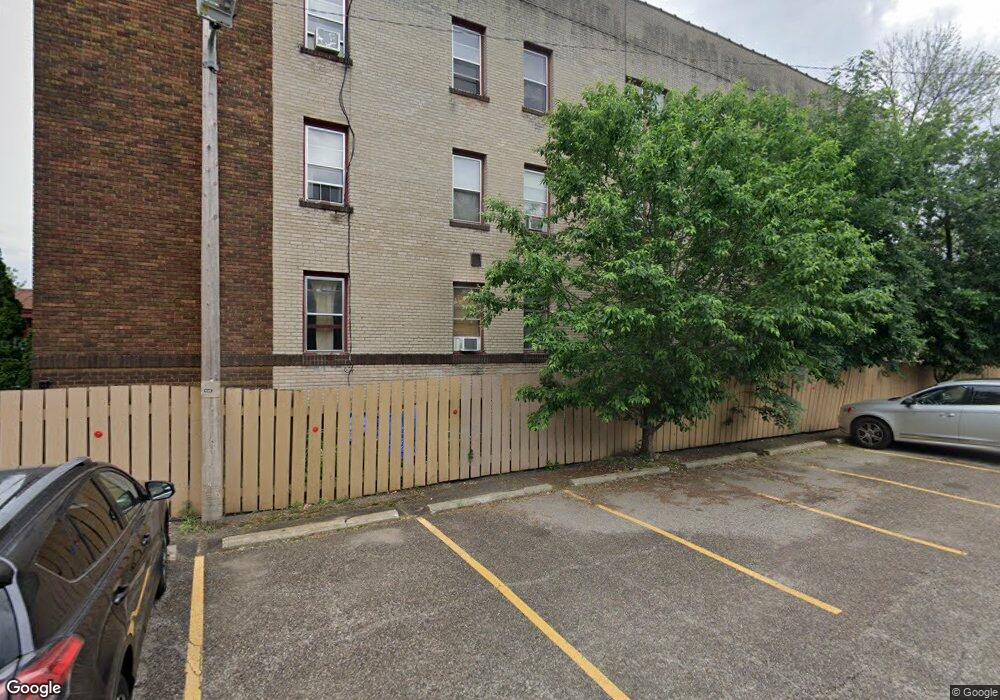
2218 Nicollet Ave Unit 35 Minneapolis, MN 55404
Whittier NeighborhoodEstimated Value: $99,000 - $115,000
1
Bed
1
Bath
506
Sq Ft
$205/Sq Ft
Est. Value
About This Home
This home is located at 2218 Nicollet Ave Unit 35, Minneapolis, MN 55404 and is currently estimated at $103,798, approximately $205 per square foot. 2218 Nicollet Ave Unit 35 is a home located in Hennepin County with nearby schools including Whittier International, Andersen United Middle School, and Andersen Middle.
Ownership History
Date
Name
Owned For
Owner Type
Purchase Details
Closed on
May 15, 2013
Sold by
Buechler Chad
Bought by
Marson Corissa
Current Estimated Value
Home Financials for this Owner
Home Financials are based on the most recent Mortgage that was taken out on this home.
Original Mortgage
$53,100
Interest Rate
5%
Mortgage Type
Seller Take Back
Purchase Details
Closed on
Dec 18, 2012
Sold by
Federal Home Loan Mortgage Corporation
Bought by
Buechler Chad
Purchase Details
Closed on
Aug 9, 2012
Sold by
Wells Fargo Bank Na
Bought by
Federal Home Loan Mortgage Corporation
Purchase Details
Closed on
Feb 8, 2012
Sold by
Sally Feldt
Bought by
Wells Fargo Bank Na
Purchase Details
Closed on
May 24, 2006
Sold by
Sweeney Melissa
Bought by
Feblt Sally
Purchase Details
Closed on
Nov 25, 2002
Sold by
Close Sarah B
Bought by
Sweeney Melissa C
Create a Home Valuation Report for This Property
The Home Valuation Report is an in-depth analysis detailing your home's value as well as a comparison with similar homes in the area
Home Values in the Area
Average Home Value in this Area
Purchase History
| Date | Buyer | Sale Price | Title Company |
|---|---|---|---|
| Marson Corissa | $59,000 | Cities Title Services Llc | |
| Buechler Chad | -- | None Available | |
| Federal Home Loan Mortgage Corporation | -- | None Available | |
| Wells Fargo Bank Na | $86,546 | -- | |
| Wells Fargo Bank Na | $85,546 | None Available | |
| Feblt Sally | $113,400 | -- | |
| Sweeney Melissa C | $97,000 | -- |
Source: Public Records
Mortgage History
| Date | Status | Borrower | Loan Amount |
|---|---|---|---|
| Closed | Marson Corissa | $53,100 |
Source: Public Records
Tax History Compared to Growth
Tax History
| Year | Tax Paid | Tax Assessment Tax Assessment Total Assessment is a certain percentage of the fair market value that is determined by local assessors to be the total taxable value of land and additions on the property. | Land | Improvement |
|---|---|---|---|---|
| 2024 | $1,111 | $108,000 | $9,000 | $99,000 |
| 2023 | $1,100 | $109,000 | $10,000 | $99,000 |
| 2022 | $1,392 | $118,000 | $10,000 | $108,000 |
| 2021 | $1,299 | $124,000 | $10,000 | $114,000 |
| 2020 | $1,411 | $120,500 | $6,900 | $113,600 |
| 2019 | $1,193 | $120,500 | $6,900 | $113,600 |
| 2018 | $1,123 | $104,000 | $6,900 | $97,100 |
| 2017 | $1,058 | $91,000 | $6,900 | $84,100 |
| 2016 | $1,340 | $81,500 | $6,900 | $74,600 |
| 2015 | $1,130 | $65,000 | $6,900 | $58,100 |
| 2014 | -- | $63,500 | $6,900 | $56,600 |
Source: Public Records
Map
Nearby Homes
- 2218 Nicollet Ave Unit 23
- 2219 Pillsbury Ave S Unit 5
- 2201 Pillsbury Ave S
- 2321 Pillsbury Ave S
- 9 W Franklin Ave Unit 313
- 15 E Franklin Ave Unit 301
- 15 E Franklin Ave Unit 224
- 15 E Franklin Ave Unit 320
- 111 E Franklin Ave Unit 215
- 2500 Blaisdell Ave Unit 201
- 2500 Blaisdell Ave Unit 114
- 2500 Blaisdell Ave Unit 211
- 2015 Pleasant Ave
- 2507 1st Ave S
- 1920 Pillsbury Ave S
- 2309 Grand Ave S Unit 23
- 232 W Franklin Ave Unit 205
- 2530 1st Ave S Unit N101
- 2505 Pleasant Ave
- 1820 1st Ave S Unit 107
- 2218 Nicollet Ave Unit B2
- 2218 Nicollet Ave Unit B1
- 2218 Nicollet Ave Unit 36
- 2218 Nicollet Ave Unit 34
- 2218 Nicollet Ave Unit 33
- 2218 Nicollet Ave Unit 32
- 2218 Nicollet Ave Unit 31
- 2218 Nicollet Ave Unit 26
- 2218 Nicollet Ave Unit 25
- 2218 Nicollet Ave Unit 24
- 2218 Nicollet Ave Unit 21
- 2218 Nicollet Ave Unit 6
- 2218 Nicollet Ave Unit 5
- 2218 Nicollet Ave Unit 4
- 2218 Nicollet Ave Unit 3
- 2218 Nicollet Ave Unit 2
- 2218 Nicollet Ave Unit 1
- 2218 Nicollet Ave
- 2222 Nicollet Ave
- 2300 Nicollet Ave