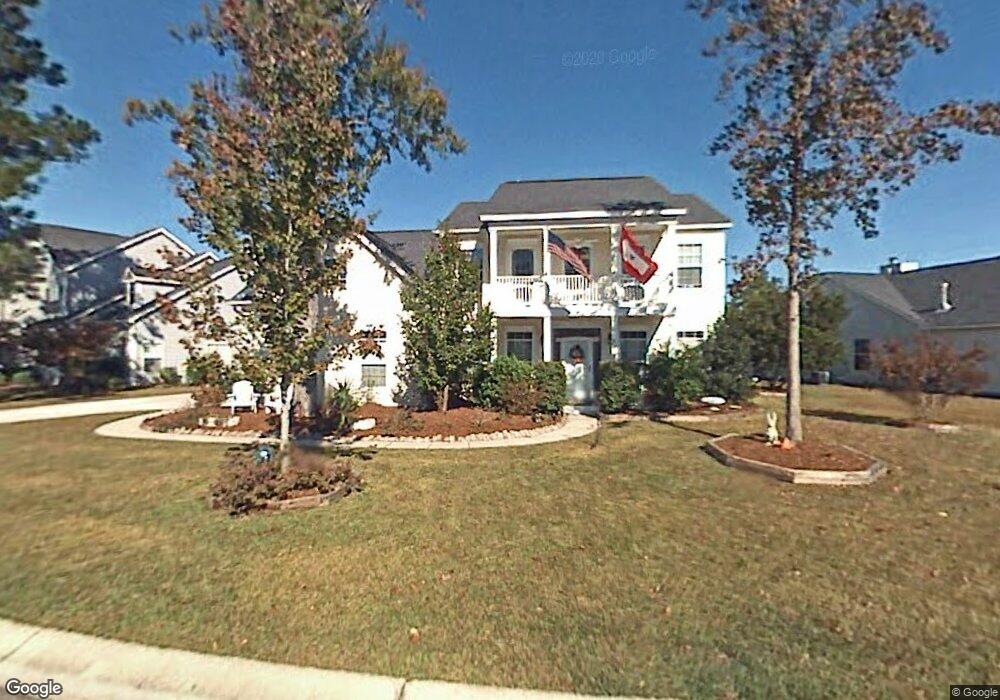
2219 Andover Way Mount Pleasant, SC 29466
Park West NeighborhoodEstimated Value: $693,000 - $840,000
4
Beds
3
Baths
2,824
Sq Ft
$275/Sq Ft
Est. Value
About This Home
This home is located at 2219 Andover Way, Mount Pleasant, SC 29466 and is currently estimated at $776,575, approximately $274 per square foot. 2219 Andover Way is a home located in Charleston County with nearby schools including Charles Pinckney Elementary School, Laurel Hill Primary School, and Thomas C. Cario Middle School.
Ownership History
Date
Name
Owned For
Owner Type
Purchase Details
Closed on
Jun 18, 2009
Sold by
Prudential Relocation Inc
Bought by
Shelton Derrick R and Shelton Megan
Current Estimated Value
Home Financials for this Owner
Home Financials are based on the most recent Mortgage that was taken out on this home.
Original Mortgage
$340,862
Outstanding Balance
$216,636
Interest Rate
4.88%
Mortgage Type
FHA
Estimated Equity
$559,939
Purchase Details
Closed on
Jun 12, 2009
Sold by
Willis Mark J and Willis Theresa N
Bought by
Prudential Relocation Inc
Home Financials for this Owner
Home Financials are based on the most recent Mortgage that was taken out on this home.
Original Mortgage
$340,862
Outstanding Balance
$216,636
Interest Rate
4.88%
Mortgage Type
FHA
Estimated Equity
$559,939
Purchase Details
Closed on
Sep 14, 2001
Sold by
Beazer Homes Corp
Bought by
Willis Mark J and Willis Theresa N
Purchase Details
Closed on
Sep 6, 2001
Sold by
Park West Lot Option Mount Pleasant Llc
Bought by
Beazer Homes Corp
Create a Home Valuation Report for This Property
The Home Valuation Report is an in-depth analysis detailing your home's value as well as a comparison with similar homes in the area
Home Values in the Area
Average Home Value in this Area
Purchase History
| Date | Buyer | Sale Price | Title Company |
|---|---|---|---|
| Shelton Derrick R | $350,000 | -- | |
| Prudential Relocation Inc | $350,000 | -- | |
| Willis Mark J | $230,801 | -- | |
| Beazer Homes Corp | $225,190 | -- |
Source: Public Records
Mortgage History
| Date | Status | Borrower | Loan Amount |
|---|---|---|---|
| Open | Shelton Derrick R | $340,862 |
Source: Public Records
Tax History Compared to Growth
Tax History
| Year | Tax Paid | Tax Assessment Tax Assessment Total Assessment is a certain percentage of the fair market value that is determined by local assessors to be the total taxable value of land and additions on the property. | Land | Improvement |
|---|---|---|---|---|
| 2024 | $1,682 | $16,270 | $0 | $0 |
| 2023 | $1,682 | $16,270 | $0 | $0 |
| 2022 | $1,534 | $16,270 | $0 | $0 |
| 2021 | $1,684 | $16,270 | $0 | $0 |
| 2020 | $1,740 | $16,270 | $0 | $0 |
| 2019 | $1,527 | $14,200 | $0 | $0 |
| 2017 | $1,505 | $14,200 | $0 | $0 |
| 2016 | $1,434 | $14,200 | $0 | $0 |
| 2015 | $1,498 | $14,200 | $0 | $0 |
| 2014 | $1,403 | $0 | $0 | $0 |
| 2011 | -- | $0 | $0 | $0 |
Source: Public Records
Map
Nearby Homes
- 2979 Bobo Rd
- 2339 Parsonage Woods Ln
- 2855 Wagner Way
- 1650 Bridwell Ln
- 2945 Bobo Rd
- 0 Nye View Cir Unit 25026581
- 2805 Wagner Way
- 1479 Brightwood Dr
- 3041 Nye View Cir
- 1550 Moss Spring Rd
- 3030 Murduck Dr
- 1817 Chauncys Ct
- 1690 Highway 41
- 3061 Caspian Ct
- 1496 Cypress Pointe Dr
- 1532 Joe Rouse Rd
- 1528 Oxborough Cir Unit 1528
- 3028 Caspian Ct
- 0 Sc-41 Unit 22020592
- 0 Joe Rouse Rd Unit 20031882
- 2231 Andover Way
- 2215 Andover Way
- 2211 Andover Way
- 2235 Andover Way
- 2232 Andover Way
- 2220 Andover Way
- 2224 Andover Way
- 2216 Andover Way
- 2207 Andover Way
- 2239 Andover Way
- 2236 Andover Way
- 2228 Andover Way
- 2212 Andover Way
- 2376 Parsonage Woods Ln
- 2380 Parsonage Woods Ln
- 2240 Andover Way
- 2203 Andover Way
- 2372 Parsonage Woods Ln
- 2208 Andover Way
- 2384 Parsonage Woods Ln