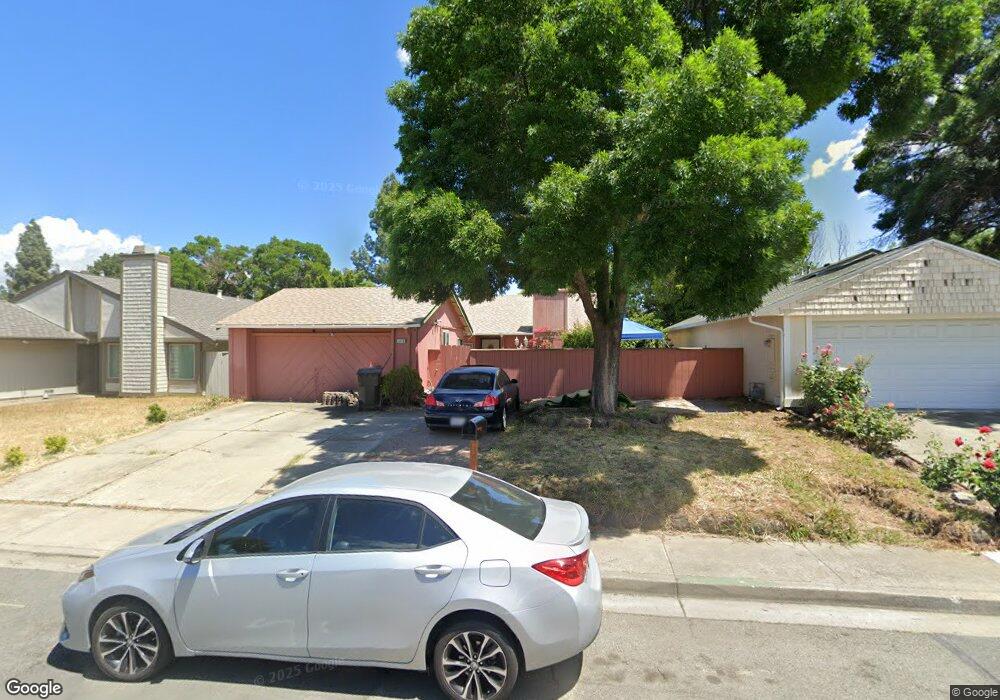
2219 Lynbrook Dr Pittsburg, CA 94565
Meadowbrook NeighborhoodEstimated Value: $535,148 - $580,000
3
Beds
2
Baths
1,344
Sq Ft
$420/Sq Ft
Est. Value
About This Home
This home is located at 2219 Lynbrook Dr, Pittsburg, CA 94565 and is currently estimated at $564,287, approximately $419 per square foot. 2219 Lynbrook Dr is a home located in Contra Costa County with nearby schools including Stoneman Elementary School, Hillview Junior High School, and Pittsburg Senior High School.
Ownership History
Date
Name
Owned For
Owner Type
Purchase Details
Closed on
Jan 24, 2000
Sold by
Pacific Community Services Inc
Bought by
Arellano Jose A and Arellano Ana L
Current Estimated Value
Home Financials for this Owner
Home Financials are based on the most recent Mortgage that was taken out on this home.
Original Mortgage
$130,400
Outstanding Balance
$42,709
Interest Rate
8.25%
Mortgage Type
Purchase Money Mortgage
Estimated Equity
$521,578
Purchase Details
Closed on
Aug 17, 1999
Sold by
Hud
Bought by
Pacific Community Services Inc
Home Financials for this Owner
Home Financials are based on the most recent Mortgage that was taken out on this home.
Original Mortgage
$118,864
Interest Rate
7.56%
Mortgage Type
FHA
Purchase Details
Closed on
Oct 29, 1998
Sold by
Harbourton Mtg Co Lp
Bought by
Hud
Purchase Details
Closed on
Dec 29, 1997
Sold by
Schmidt John W and Schmidt Tonya K
Bought by
Harbourton Mtg Co Lp
Create a Home Valuation Report for This Property
The Home Valuation Report is an in-depth analysis detailing your home's value as well as a comparison with similar homes in the area
Home Values in the Area
Average Home Value in this Area
Purchase History
| Date | Buyer | Sale Price | Title Company |
|---|---|---|---|
| Arellano Jose A | $163,000 | North American Title Co | |
| Pacific Community Services Inc | $128,000 | North American Title Co | |
| Hud | -- | -- | |
| Harbourton Mtg Co Lp | $141,279 | American Title Co |
Source: Public Records
Mortgage History
| Date | Status | Borrower | Loan Amount |
|---|---|---|---|
| Open | Arellano Jose A | $130,400 | |
| Previous Owner | Pacific Community Services Inc | $118,864 | |
| Closed | Arellano Jose A | $32,600 |
Source: Public Records
Tax History
| Year | Tax Paid | Tax Assessment Tax Assessment Total Assessment is a certain percentage of the fair market value that is determined by local assessors to be the total taxable value of land and additions on the property. | Land | Improvement |
|---|---|---|---|---|
| 2025 | $3,478 | $250,502 | $53,780 | $196,722 |
| 2024 | $3,358 | $245,591 | $52,726 | $192,865 |
| 2023 | $3,358 | $240,777 | $51,693 | $189,084 |
| 2022 | $3,399 | $236,057 | $50,680 | $185,377 |
| 2021 | $3,391 | $231,430 | $49,687 | $181,743 |
| 2019 | $3,225 | $224,567 | $48,214 | $176,353 |
| 2018 | $3,103 | $220,165 | $47,269 | $172,896 |
| 2017 | $3,076 | $215,849 | $46,343 | $169,506 |
| 2016 | $2,848 | $211,618 | $45,435 | $166,183 |
| 2015 | $2,980 | $208,440 | $44,753 | $163,687 |
| 2014 | $2,773 | $195,000 | $41,868 | $153,132 |
Source: Public Records
Map
Nearby Homes
- 2221 Lynbrook Dr
- 2217 Lynbrook Dr
- 2223 Lynbrook Dr
- 2215 Lynbrook Dr
- 2220 Lynbrook Dr
- 2213 Lynbrook Dr
- 2218 Lynbrook Dr
- 2225 Lynbrook Dr
- 2222 Lynbrook Dr
- 2202 Lynbrook Dr
- 2211 Lynbrook Dr
- 2224 Lynbrook Dr
- 2200 Lynbrook Dr
- 2215 Fairbourne Dr
- 2225 Fairbourne Dr
- 2201 Fairbourne Dr
- 2226 Lynbrook Dr
- 2209 Lynbrook Dr
- 2227 Fairbourne Dr
- 2203 Fairbourne Dr
Your Personal Tour Guide
Ask me questions while you tour the home.