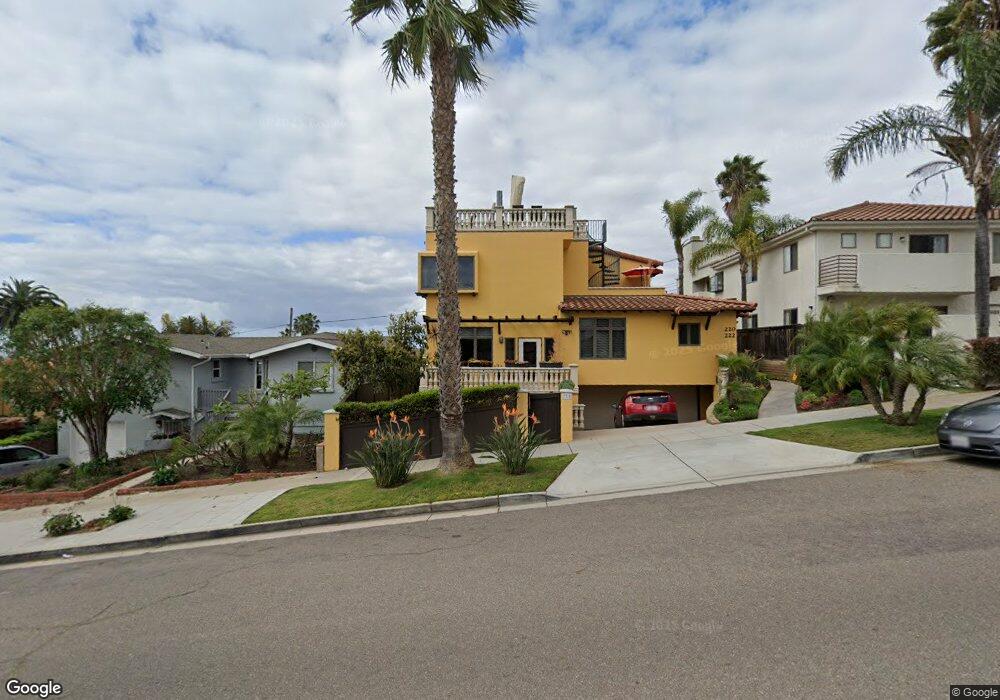
222 3rd St Encinitas, CA 92024
Central Encinitas NeighborhoodEstimated Value: $2,880,157 - $3,914,000
4
Beds
3
Baths
2,327
Sq Ft
$1,446/Sq Ft
Est. Value
About This Home
This home is located at 222 3rd St, Encinitas, CA 92024 and is currently estimated at $3,364,289, approximately $1,445 per square foot. 222 3rd St is a home located in San Diego County with nearby schools including Paul Ecke-Central Elementary, Diegueno Middle School, and La Costa Canyon High School.
Ownership History
Date
Name
Owned For
Owner Type
Purchase Details
Closed on
Oct 24, 2024
Sold by
Helfand Holly A and Anderson Holly Helfand
Bought by
Holly H Anderson Trust and Anderson
Current Estimated Value
Purchase Details
Closed on
Aug 23, 2024
Sold by
Anderson W Thomas
Bought by
Anderson Holly Helfand
Home Financials for this Owner
Home Financials are based on the most recent Mortgage that was taken out on this home.
Original Mortgage
$450,000
Interest Rate
6.08%
Mortgage Type
New Conventional
Purchase Details
Closed on
Jan 5, 1998
Sold by
Anderson W Thomas and Hefland Holly A
Bought by
Anderson W Thomas and Helfand Holly A
Home Financials for this Owner
Home Financials are based on the most recent Mortgage that was taken out on this home.
Original Mortgage
$701,250
Interest Rate
7.16%
Mortgage Type
Construction
Create a Home Valuation Report for This Property
The Home Valuation Report is an in-depth analysis detailing your home's value as well as a comparison with similar homes in the area
Home Values in the Area
Average Home Value in this Area
Purchase History
| Date | Buyer | Sale Price | Title Company |
|---|---|---|---|
| Holly H Anderson Trust | -- | Fidelity National Title | |
| Anderson Holly Helfand | -- | Fidelity National Title | |
| Anderson W Thomas | -- | Fidelity National Title |
Source: Public Records
Mortgage History
| Date | Status | Borrower | Loan Amount |
|---|---|---|---|
| Previous Owner | Anderson Holly Helfand | $450,000 | |
| Previous Owner | Anderson W Thomas | $701,250 |
Source: Public Records
Tax History
| Year | Tax Paid | Tax Assessment Tax Assessment Total Assessment is a certain percentage of the fair market value that is determined by local assessors to be the total taxable value of land and additions on the property. | Land | Improvement |
|---|---|---|---|---|
| 2025 | $6,486 | $599,276 | $219,903 | $379,373 |
| 2024 | $6,486 | $587,527 | $215,592 | $371,935 |
| 2023 | $6,268 | $576,008 | $211,365 | $364,643 |
| 2022 | $6,146 | $564,715 | $207,221 | $357,494 |
| 2021 | $6,128 | $553,643 | $203,158 | $350,485 |
| 2020 | $6,044 | $547,967 | $201,075 | $346,892 |
| 2019 | $5,923 | $537,224 | $197,133 | $340,091 |
| 2018 | $5,818 | $526,691 | $193,268 | $333,423 |
| 2017 | $5,721 | $516,365 | $189,479 | $326,886 |
| 2016 | $5,535 | $506,241 | $185,764 | $320,477 |
| 2015 | $5,465 | $498,638 | $182,974 | $315,664 |
| 2014 | $5,337 | $488,871 | $179,390 | $309,481 |
Source: Public Records
Map
Nearby Homes
- 201 4th St Unit A & B
- 231 5th St
- 90 N Coast Highway 101 Unit 310
- 90 N Coast Highway 101
- 100 5th St
- 215 N Vulcan Ave
- 200 Neptune Ave Unit 2
- 538 4th St
- 687 S Coast Highway 101 Unit 223
- 806 4th St
- 554 & 556 Stratford Dr
- 233 Mangano Cir
- 103 Mangano Cir
- 922 Sealane Dr Unit B
- 498 Neptune Ave
- 523 N Vulcan Ave Unit SPC 24A
- 523 N Vulcan Ave Unit 3
- 523 N Vulcan Ave Unit 41
- 523 N Vulcan Ave Unit 43
- 370 Carmel Creeper Place Unit 8
Your Personal Tour Guide
Ask me questions while you tour the home.