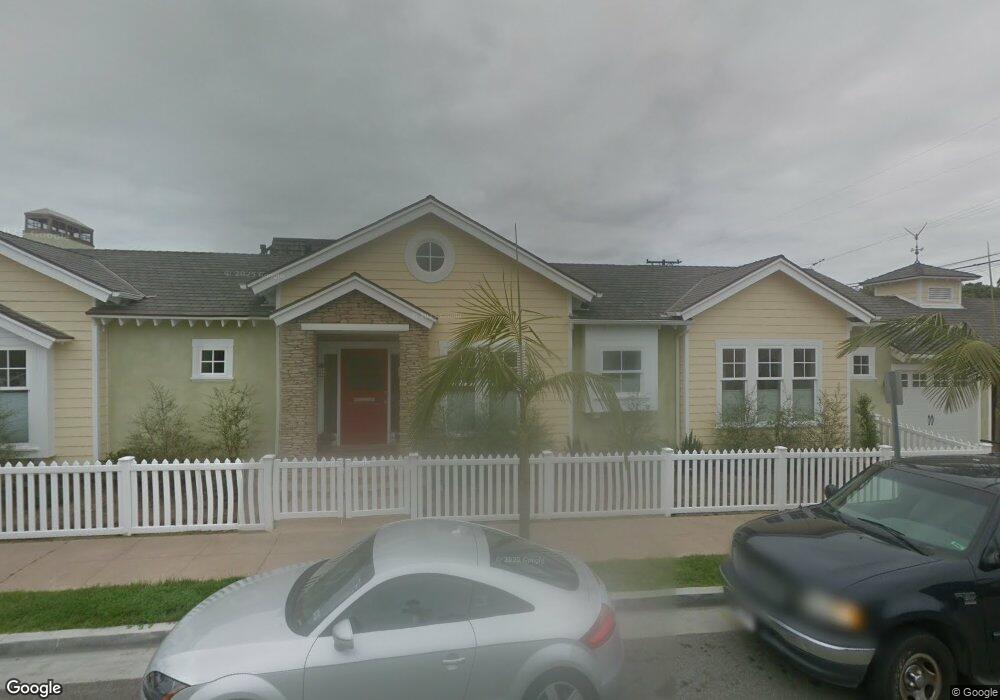
222 Central Way Seal Beach, CA 90740
Estimated Value: $2,293,000 - $2,589,000
2
Beds
2
Baths
2,387
Sq Ft
$1,029/Sq Ft
Est. Value
About This Home
This home is located at 222 Central Way, Seal Beach, CA 90740 and is currently estimated at $2,456,339, approximately $1,029 per square foot. 222 Central Way is a home located in Orange County with nearby schools including J. H. Mcgaugh Elementary School, Jack L. Weaver Elementary School, and Sharon Christa Mcauliffe Middle School.
Ownership History
Date
Name
Owned For
Owner Type
Purchase Details
Closed on
Apr 13, 2009
Sold by
Gilchrist James R
Bought by
Mannone Louis Jack F and Mannone Pamela Rose
Current Estimated Value
Home Financials for this Owner
Home Financials are based on the most recent Mortgage that was taken out on this home.
Original Mortgage
$417,000
Outstanding Balance
$261,908
Interest Rate
4.82%
Mortgage Type
Purchase Money Mortgage
Estimated Equity
$2,194,431
Create a Home Valuation Report for This Property
The Home Valuation Report is an in-depth analysis detailing your home's value as well as a comparison with similar homes in the area
Home Values in the Area
Average Home Value in this Area
Purchase History
| Date | Buyer | Sale Price | Title Company |
|---|---|---|---|
| Mannone Louis Jack F | $1,040,000 | Chicago Title Company |
Source: Public Records
Mortgage History
| Date | Status | Borrower | Loan Amount |
|---|---|---|---|
| Open | Mannone Louis Jack F | $417,000 |
Source: Public Records
Tax History Compared to Growth
Tax History
| Year | Tax Paid | Tax Assessment Tax Assessment Total Assessment is a certain percentage of the fair market value that is determined by local assessors to be the total taxable value of land and additions on the property. | Land | Improvement |
|---|---|---|---|---|
| 2025 | $9,288 | $795,491 | $322,533 | $472,958 |
| 2024 | $9,288 | $779,894 | $316,209 | $463,685 |
| 2023 | $9,079 | $764,602 | $310,008 | $454,594 |
| 2022 | $8,983 | $749,610 | $303,929 | $445,681 |
| 2021 | $8,783 | $734,912 | $297,969 | $436,943 |
| 2020 | $8,793 | $727,377 | $294,914 | $432,463 |
| 2019 | $8,524 | $713,115 | $289,131 | $423,984 |
| 2018 | $8,137 | $699,133 | $283,462 | $415,671 |
| 2017 | $7,966 | $685,425 | $277,904 | $407,521 |
| 2016 | $7,814 | $671,986 | $272,455 | $399,531 |
| 2015 | $7,716 | $661,893 | $268,363 | $393,530 |
| 2014 | $7,529 | $648,928 | $263,106 | $385,822 |
Source: Public Records
Map
Nearby Homes
- 112 114 4th St
- 111 5th St
- 207 1st St
- 208 Ocean Place
- 244 5th St
- 232 7th St
- 805 Ocean Ave Unit 6
- 123 Cottonwood Ln
- 18 Cottonwood Ln
- 30 Welcome Ln
- 96 Welcome Ln
- 84 Riversea Rd
- 85 Riversea Rd
- 48 Riversea Rd
- 41 Riversea Rd
- 217 10th St
- 620 Coastline Dr
- 7019 E Seaside Walk
- 815 Marvista Ave
- 6819 E Ocean Blvd