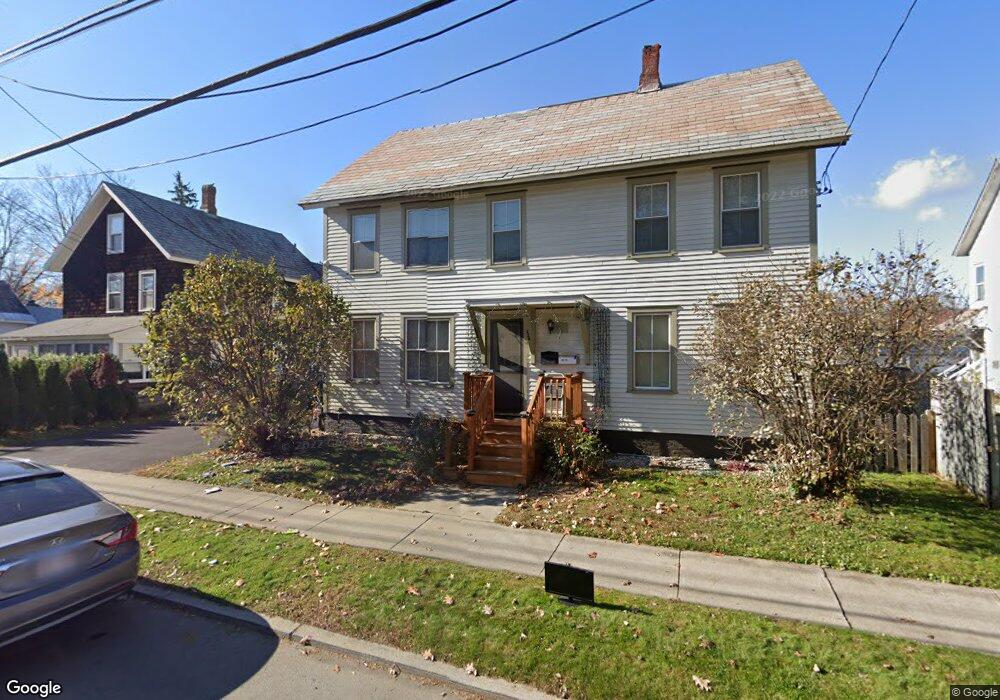
222 Chapman St Unit 224 Greenfield, MA 01301
Estimated Value: $250,000 - $300,000
5
Beds
2
Baths
2,600
Sq Ft
$103/Sq Ft
Est. Value
About This Home
This home is located at 222 Chapman St Unit 224, Greenfield, MA 01301 and is currently estimated at $267,885, approximately $103 per square foot. 222 Chapman St Unit 224 is a home located in Franklin County with nearby schools including Cornerstone Christian School and Holy Trinity School.
Ownership History
Date
Name
Owned For
Owner Type
Purchase Details
Closed on
Aug 1, 2018
Sold by
Sibley Clayton W
Bought by
Sibley 2Nd Clayton W
Current Estimated Value
Purchase Details
Closed on
Oct 26, 1993
Sold by
Madson Dennis L
Bought by
Sibley Clayton W
Create a Home Valuation Report for This Property
The Home Valuation Report is an in-depth analysis detailing your home's value as well as a comparison with similar homes in the area
Home Values in the Area
Average Home Value in this Area
Purchase History
| Date | Buyer | Sale Price | Title Company |
|---|---|---|---|
| Sibley 2Nd Clayton W | -- | -- | |
| Sibley 2Nd Clayton W | -- | -- | |
| Sibley Clayton W | $65,000 | -- | |
| Sibley Clayton W | $65,000 | -- |
Source: Public Records
Mortgage History
| Date | Status | Borrower | Loan Amount |
|---|---|---|---|
| Previous Owner | Sibley Clayton W | $30,000 | |
| Previous Owner | Sibley Clayton W | $85,000 | |
| Previous Owner | Sibley Clayton W | $29,530 |
Source: Public Records
Tax History Compared to Growth
Tax History
| Year | Tax Paid | Tax Assessment Tax Assessment Total Assessment is a certain percentage of the fair market value that is determined by local assessors to be the total taxable value of land and additions on the property. | Land | Improvement |
|---|---|---|---|---|
| 2025 | $4,106 | $209,900 | $62,500 | $147,400 |
| 2024 | $4,003 | $196,300 | $50,200 | $146,100 |
| 2023 | $3,495 | $177,100 | $50,200 | $126,900 |
| 2022 | $3,252 | $145,700 | $45,400 | $100,300 |
| 2021 | $3,111 | $134,000 | $45,100 | $88,900 |
| 2020 | $2,979 | $129,900 | $41,000 | $88,900 |
| 2019 | $2,786 | $124,600 | $35,700 | $88,900 |
| 2018 | $2,727 | $121,600 | $35,000 | $86,600 |
| 2017 | $2,642 | $121,600 | $35,000 | $86,600 |
| 2016 | $2,711 | $124,300 | $33,600 | $90,700 |
| 2015 | $2,769 | $123,000 | $37,700 | $85,300 |
| 2014 | $2,513 | $122,400 | $37,700 | $84,700 |
Source: Public Records
Map
Nearby Homes
- 228 Chapman St
- 220 Chapman St
- 226-228 Chapman St
- 226 Chapman St Unit 228
- 230 Chapman St
- 216 Chapman St
- 229 Chapman St Unit 231
- 232 Chapman St
- 232-234 Chapman St
- 223 Chapman St
- 227 Chapman St
- 234 Chapman St
- 221 Chapman St
- 212 Chapman St
- 217 Chapman St
- 236 Chapman St
- 213 Chapman St
- 233 Chapman St
- 43 Walnut St
- 208 Chapman St