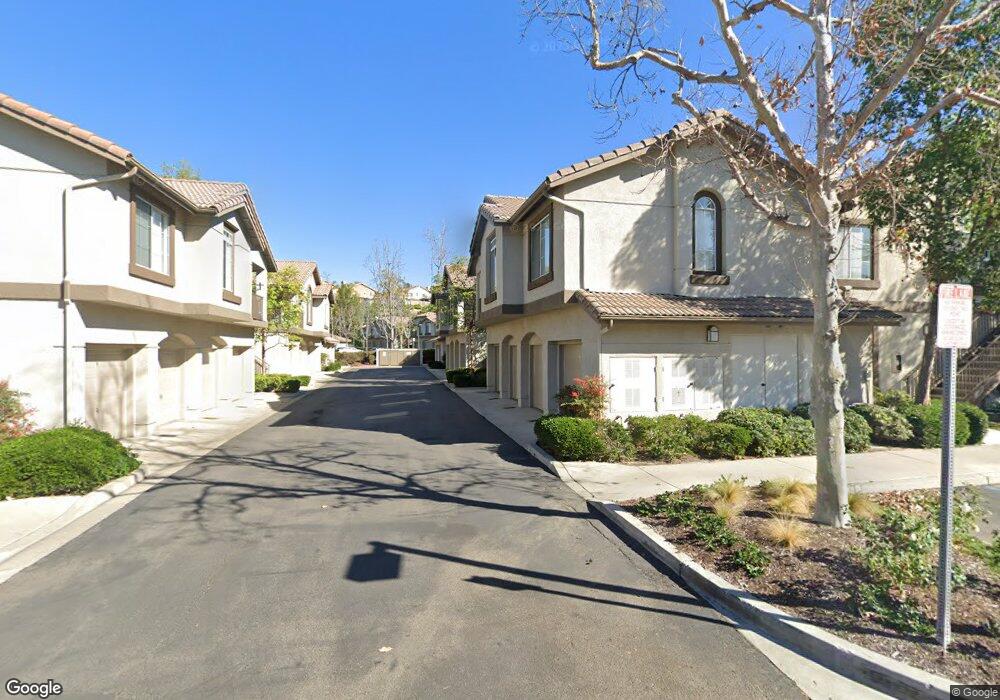
222 Chaumont Cir Unit 127 Foothill Ranch, CA 92610
Estimated Value: $641,000 - $680,000
3
Beds
2
Baths
1,104
Sq Ft
$594/Sq Ft
Est. Value
About This Home
This home is located at 222 Chaumont Cir Unit 127, Foothill Ranch, CA 92610 and is currently estimated at $655,764, approximately $593 per square foot. 222 Chaumont Cir Unit 127 is a home located in Orange County with nearby schools including Foothill Ranch Elementary School, Rancho Santa Margarita Intermediate School, and Trabuco Hills High School.
Ownership History
Date
Name
Owned For
Owner Type
Purchase Details
Closed on
Nov 28, 2016
Sold by
Gladden Michelle R
Bought by
Gladden Michelle R and The Michelle R Gladden Trust
Current Estimated Value
Home Financials for this Owner
Home Financials are based on the most recent Mortgage that was taken out on this home.
Original Mortgage
$66,000
Outstanding Balance
$9,553
Interest Rate
3.47%
Mortgage Type
New Conventional
Estimated Equity
$646,211
Purchase Details
Closed on
Dec 4, 2008
Sold by
Gladden Michelle R
Bought by
Gladden Michelle R and The Michelle R Gladden Trust
Purchase Details
Closed on
Dec 11, 1995
Sold by
Centex Real Estate Corp
Bought by
Gladden Michelle R
Home Financials for this Owner
Home Financials are based on the most recent Mortgage that was taken out on this home.
Original Mortgage
$117,650
Interest Rate
7.38%
Mortgage Type
FHA
Create a Home Valuation Report for This Property
The Home Valuation Report is an in-depth analysis detailing your home's value as well as a comparison with similar homes in the area
Home Values in the Area
Average Home Value in this Area
Purchase History
| Date | Buyer | Sale Price | Title Company |
|---|---|---|---|
| Gladden Michelle R | -- | Timios Title | |
| Gladden Michelle R | -- | Timios Title | |
| Gladden Michelle R | -- | None Available | |
| Gladden Michelle R | $136,500 | First American Title Ins |
Source: Public Records
Mortgage History
| Date | Status | Borrower | Loan Amount |
|---|---|---|---|
| Open | Gladden Michelle R | $66,000 | |
| Closed | Gladden Michelle R | $117,650 |
Source: Public Records
Tax History Compared to Growth
Tax History
| Year | Tax Paid | Tax Assessment Tax Assessment Total Assessment is a certain percentage of the fair market value that is determined by local assessors to be the total taxable value of land and additions on the property. | Land | Improvement |
|---|---|---|---|---|
| 2025 | $2,247 | $226,250 | $81,048 | $145,202 |
| 2024 | $2,247 | $221,814 | $79,459 | $142,355 |
| 2023 | $2,193 | $217,465 | $77,901 | $139,564 |
| 2022 | $2,152 | $213,201 | $76,373 | $136,828 |
| 2021 | $1,839 | $209,021 | $74,875 | $134,146 |
| 2020 | $2,089 | $206,878 | $74,107 | $132,771 |
| 2019 | $2,046 | $202,822 | $72,654 | $130,168 |
| 2018 | $2,006 | $198,846 | $71,230 | $127,616 |
| 2017 | $1,965 | $194,948 | $69,834 | $125,114 |
| 2016 | $2,239 | $191,126 | $68,465 | $122,661 |
| 2015 | $2,233 | $188,256 | $67,437 | $120,819 |
| 2014 | $2,470 | $184,569 | $66,116 | $118,453 |
Source: Public Records
Map
Nearby Homes
- 228 Chaumont Cir
- 19431 Rue de Valore Unit 37A
- 19431 14H Rue de Valore
- 5 Encinal
- 131 Primrose Dr
- 32 Salinas
- 7 Pandale
- 109 Alder Ridge
- 104 Alder Ridge
- 1865 Aliso Canyon Dr
- 19415 Cascade Dr Unit 234
- 208 Pinnacle Dr
- 98 Pinnacle Dr
- 19222 Red Bluff Dr
- 1582 Sunset View Dr
- 1552 Sunset View Dr
- 200 Sierra Madre
- 15 Embassy Place
- 120 Chapman
- 200 Paddlewheel
- 224 Chaumont Cir Unit 128
- 226 Chaumont Cir
- 230 Chaumont Cir Unit 129
- 234 Chaumont Cir
- 236 Chaumont Cir Unit 130
- 238 Chaumont Cir
- 240 Chaumont Cir
- 208 Chaumont Cir Unit 113
- 210 Chaumont Cir
- 212 Chaumont Cir
- 214 Chaumont Cir
- 201 Chaumont Cir
- 216 Chaumont Cir Unit 120
- 202 Chaumont Cir
- 218 Chaumont Cir
- 218 Chaumont Cir
- 203 Chaumont Cir Unit 102
- 220 Chaumont Cir
- 205 Chaumont Cir
- 244 Chaumont Cir