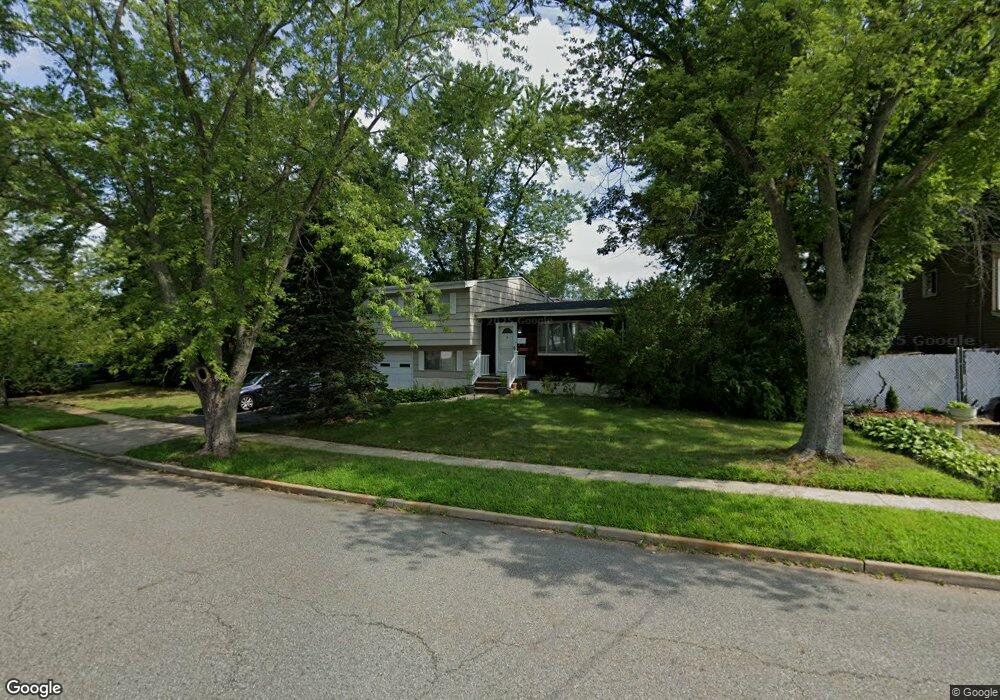
222 Cindy St Old Bridge, NJ 08857
Estimated Value: $546,000 - $610,702
3
Beds
2
Baths
1,373
Sq Ft
$428/Sq Ft
Est. Value
About This Home
This home is located at 222 Cindy St, Old Bridge, NJ 08857 and is currently estimated at $587,176, approximately $427 per square foot. 222 Cindy St is a home located in Middlesex County with nearby schools including Old Bridge High School, St. Ambrose School, and Calvary Christian School.
Ownership History
Date
Name
Owned For
Owner Type
Purchase Details
Closed on
Jan 17, 2019
Sold by
Mayo Denise and Deliz Denise
Bought by
Deliz Denise and Deliz Raymond
Current Estimated Value
Home Financials for this Owner
Home Financials are based on the most recent Mortgage that was taken out on this home.
Original Mortgage
$290,000
Outstanding Balance
$254,969
Interest Rate
4.6%
Mortgage Type
New Conventional
Estimated Equity
$332,207
Purchase Details
Closed on
Sep 17, 2014
Sold by
Kocsis James A and Kocsis Joan A
Bought by
Mayo Denise
Home Financials for this Owner
Home Financials are based on the most recent Mortgage that was taken out on this home.
Original Mortgage
$239,875
Interest Rate
4.11%
Mortgage Type
New Conventional
Create a Home Valuation Report for This Property
The Home Valuation Report is an in-depth analysis detailing your home's value as well as a comparison with similar homes in the area
Home Values in the Area
Average Home Value in this Area
Purchase History
| Date | Buyer | Sale Price | Title Company |
|---|---|---|---|
| Deliz Denise | -- | Bonafide Title Agency Llc | |
| Mayo Denise | $252,500 | Multiple |
Source: Public Records
Mortgage History
| Date | Status | Borrower | Loan Amount |
|---|---|---|---|
| Open | Deliz Denise | $290,000 | |
| Closed | Mayo Denise | $239,875 |
Source: Public Records
Tax History Compared to Growth
Tax History
| Year | Tax Paid | Tax Assessment Tax Assessment Total Assessment is a certain percentage of the fair market value that is determined by local assessors to be the total taxable value of land and additions on the property. | Land | Improvement |
|---|---|---|---|---|
| 2025 | $8,019 | $142,000 | $71,000 | $71,000 |
| 2024 | $7,692 | $142,000 | $71,000 | $71,000 |
| 2023 | $7,692 | $142,000 | $71,000 | $71,000 |
| 2022 | $7,516 | $142,000 | $71,000 | $71,000 |
| 2021 | $5,516 | $142,000 | $71,000 | $71,000 |
| 2020 | $7,295 | $142,000 | $71,000 | $71,000 |
| 2019 | $7,171 | $142,000 | $71,000 | $71,000 |
| 2018 | $7,091 | $142,000 | $71,000 | $71,000 |
| 2017 | $6,861 | $142,000 | $71,000 | $71,000 |
| 2016 | $6,719 | $142,000 | $71,000 | $71,000 |
| 2015 | $6,603 | $142,000 | $71,000 | $71,000 |
| 2014 | $6,536 | $142,000 | $71,000 | $71,000 |
Source: Public Records
Map
Nearby Homes