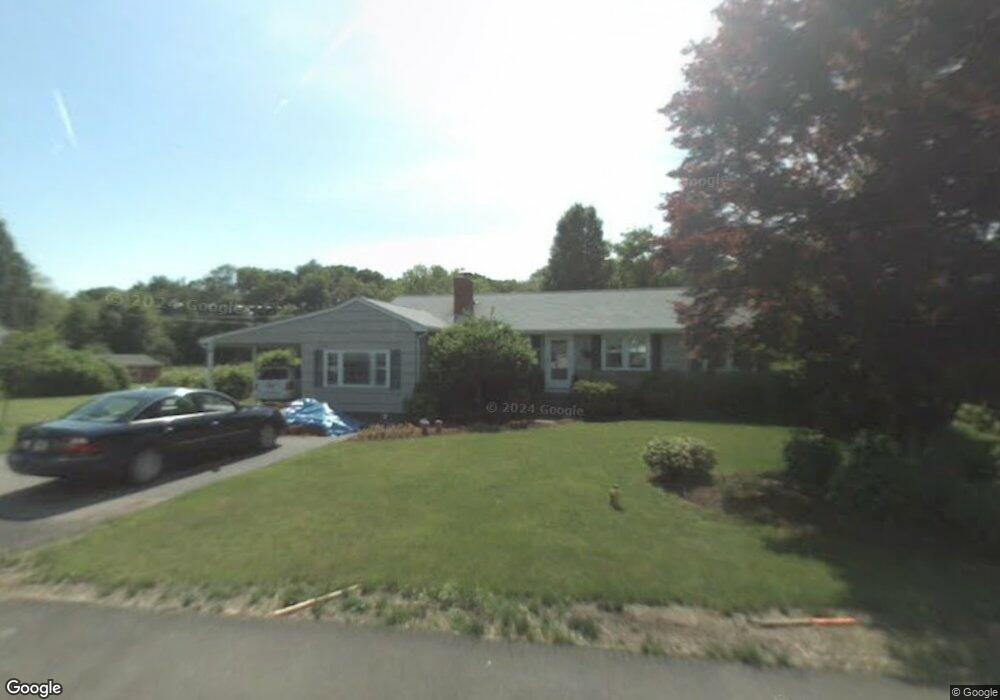
222 Elm St East Bridgewater, MA 02333
Estimated Value: $580,000 - $621,000
4
Beds
2
Baths
1,784
Sq Ft
$341/Sq Ft
Est. Value
About This Home
This home is located at 222 Elm St, East Bridgewater, MA 02333 and is currently estimated at $607,739, approximately $340 per square foot. 222 Elm St is a home located in Plymouth County with nearby schools including Central Elementary School, Gordon W Mitchell Middle School, and East Bridgewater Jr./Sr. High School.
Ownership History
Date
Name
Owned For
Owner Type
Purchase Details
Closed on
Aug 16, 1994
Sold by
Craig Jan R and Craig Betty J
Bought by
Geden Mark F and Geden Deborah J
Current Estimated Value
Home Financials for this Owner
Home Financials are based on the most recent Mortgage that was taken out on this home.
Original Mortgage
$95,100
Interest Rate
8.52%
Mortgage Type
Purchase Money Mortgage
Create a Home Valuation Report for This Property
The Home Valuation Report is an in-depth analysis detailing your home's value as well as a comparison with similar homes in the area
Home Values in the Area
Average Home Value in this Area
Purchase History
| Date | Buyer | Sale Price | Title Company |
|---|---|---|---|
| Geden Mark F | $118,900 | -- |
Source: Public Records
Mortgage History
| Date | Status | Borrower | Loan Amount |
|---|---|---|---|
| Open | Geden Mark F | $82,000 | |
| Closed | Geden Mark F | $96,500 | |
| Closed | Geden Mark F | $95,100 | |
| Previous Owner | Geden Mark F | $20,640 |
Source: Public Records
Tax History Compared to Growth
Tax History
| Year | Tax Paid | Tax Assessment Tax Assessment Total Assessment is a certain percentage of the fair market value that is determined by local assessors to be the total taxable value of land and additions on the property. | Land | Improvement |
|---|---|---|---|---|
| 2025 | $6,594 | $482,400 | $176,200 | $306,200 |
| 2024 | $6,174 | $446,100 | $169,400 | $276,700 |
| 2023 | $6,047 | $418,500 | $169,400 | $249,100 |
| 2022 | $5,979 | $383,300 | $154,100 | $229,200 |
| 2021 | $5,921 | $347,300 | $148,000 | $199,300 |
| 2020 | $10,970 | $334,000 | $142,400 | $191,600 |
| 2019 | $10,819 | $318,800 | $136,100 | $182,700 |
| 2018 | $4,358 | $300,100 | $136,100 | $164,000 |
| 2017 | $4,241 | $288,500 | $129,800 | $158,700 |
| 2016 | $5,092 | $280,400 | $129,800 | $150,600 |
| 2015 | $4,950 | $278,700 | $128,800 | $149,900 |
| 2014 | $4,796 | $276,100 | $126,100 | $150,000 |
Source: Public Records
Map
Nearby Homes
- 446 Elm St
- 11 Willow Ave
- 416 Highland St
- 22 Water St
- 11 Harmony Crossing
- 41 Bedford St
- 505 N Central St
- 407 W Union St
- 585 N Bedford St
- 25 Plain St
- 611 N Bedford St
- 20 Plain St
- 282 Spring St
- 71 Church St
- 50 Belmont St
- 9 Hemlock Dr
- 848 N Bedford St Phase III
- 848 N Bedford St
- 848 N Bedford St Phase IV
- 848 N